In January–March 2026, Europe’s battery electric car registrations recorded a 20% market share, up 4 percentage points from the same period in 2025. Meanwhile, plug-in hybrid cars also grew 1 percentage point to a 9% market share.
Registrations of conventional combustion engine cars fell by 9 percentage points to a 31% market share in the first quarter, while mild hybrids and full hybrids increased their shares to 26% and 14%, up 3 and 1 percentage points, respectively.
Germany and Italy, currently Europe’s largest car markets in 2026 to date, registered battery electric market shares of 23% and 8%, respectively, representing increases of 6 and 3 percentage points compared with January–March 2025.
France third largest European market, also saw growth, with battery electric shares at 28%, 10 percentage points up from January–March 2025. Poland increased its market share 2 percentage points to 6%.
From January 2025 to March 2026, adjusted carbon dioxide (CO2) emissions among manufacturer pools stood at 97 grams per kilometer on average, 4 grams away from the EU manufacturer average target for 2025–2027 of 93 grams per kilometer.
Among the seven largest automakers in Europe, the BMW Group registered the highest battery electric car share in January–March 2026 at 26%. The Hyundai and Toyota groups recorded the highest increase in battery electric car shares compared with January–March 2025, up 5 percentage points each to a respective 22% and 8% share.
Over 1.17 million public charging points had been installed in Europe by the end of March 2026. Belgium recorded the greatest growth from March 2025 to March 2026, with a 43% increase in direct current (DC) charging points and a 28% increase in alternating current (AC) charging points.
Spanish maket
In Spain, battery electric vehicle share reached 9%, up 2 percentage points compared to January–March 2025.
Spain’s charging network is expanding steadily: by Q1 2026, Spain had 38,932 AC and 16,487 DC public charging points, with growth of +13% and +27% respectively compared to Q1 2025—showing stronger momentum in fast charging.
Although AC chargers still dominate in Spain, the significantly higher growth in DC (+27%) suggests a gradual move toward faster charging solutions, aligning with broader European trends.
CO₂ emissions from the sector
EU carmakers are required to cut CO₂ emissions annually between 2025 and 2029, with compliance assessed in 2027 based on 2025–2027 averages, using tools like pooling, credits from low-emission vehicles, and eco-innovations—while increasing electric car sales remains the main strategy to avoid penalties.
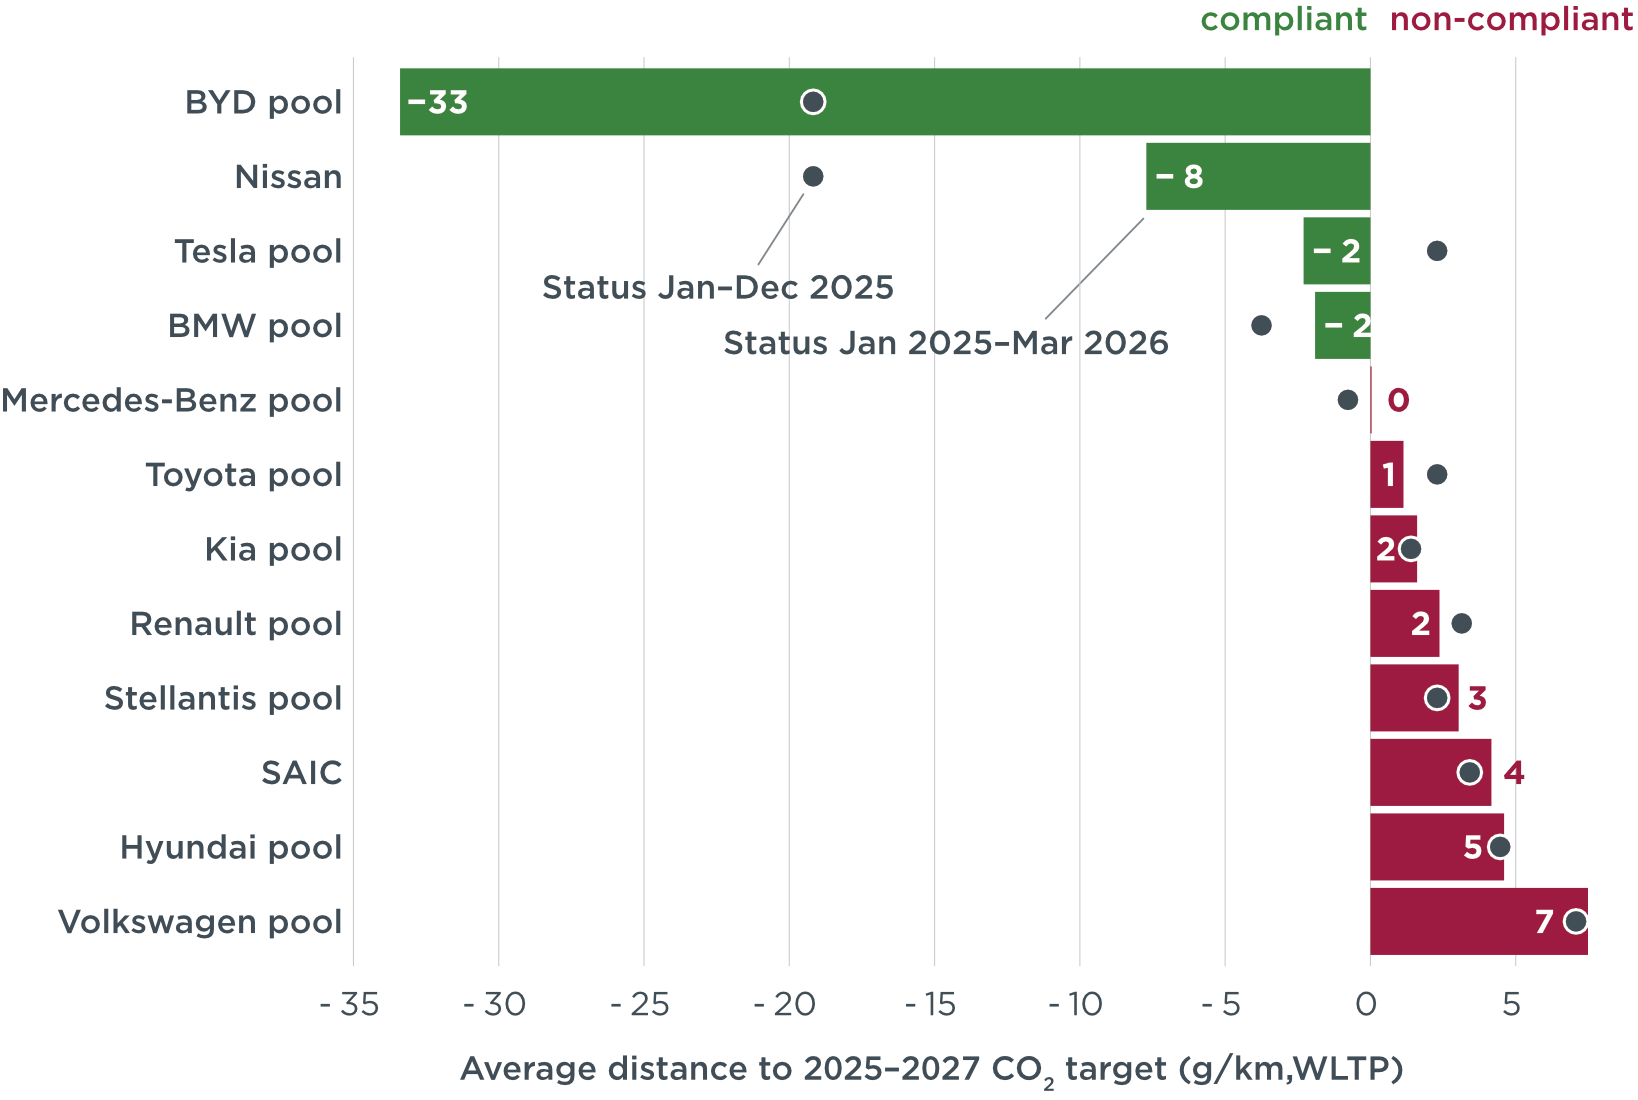
Between January 2025 and March 2026, average emissions were 97 g CO₂/km—around 3 g above the 93 g target—leaving the sector slightly off track overall, although groups like BYD, Nissan, Tesla/BMW, and Mercedes-Benz are meeting targets, while Volkswagen lags behind.
In March 2026, new battery electric car registrations increased around 50% in Europe compared with March 2025, reaching a 21% market share out of all new registrations. Meanwhile, overall registrations for all powertrains increased 13% during the same period. This brought the average share of battery electric vehicles (BEVs) among total new registrations in Europe to 20% in January–March 2026, surpassing the 2025 average and marking a 4-percentage-point increase compared with the same period in 2025 (see Figure 1).
Figure 1
Share of battery electric vehicles among new passenger car registrations in Europe
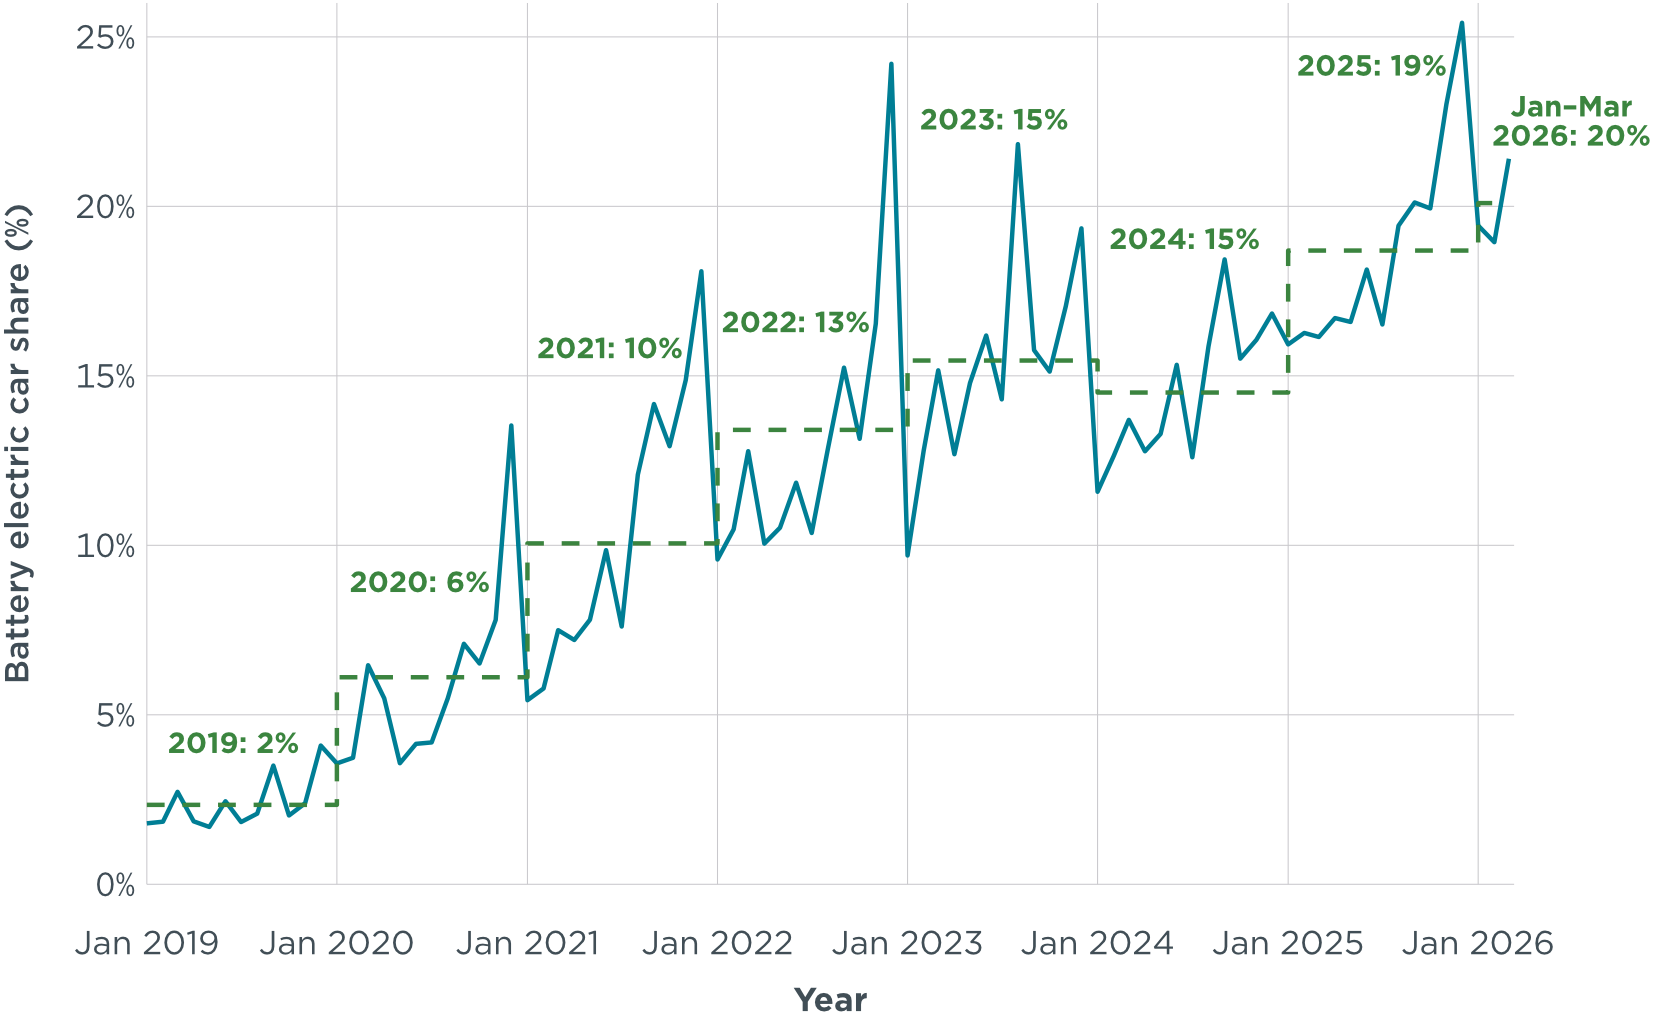
The March figure marks a notable acceleration relative to February 2026—which saw battery electric car registrations grow 18% year-on-year—and the first quarter of 2026 overall, when growth averaged 29%. This coincided with a sharp rise in crude oil prices following the closure of the Strait of Hormuz and recent national purchase schemes supporting car electrification in Germany, France, and Italy—variables that warrant additional analysis.
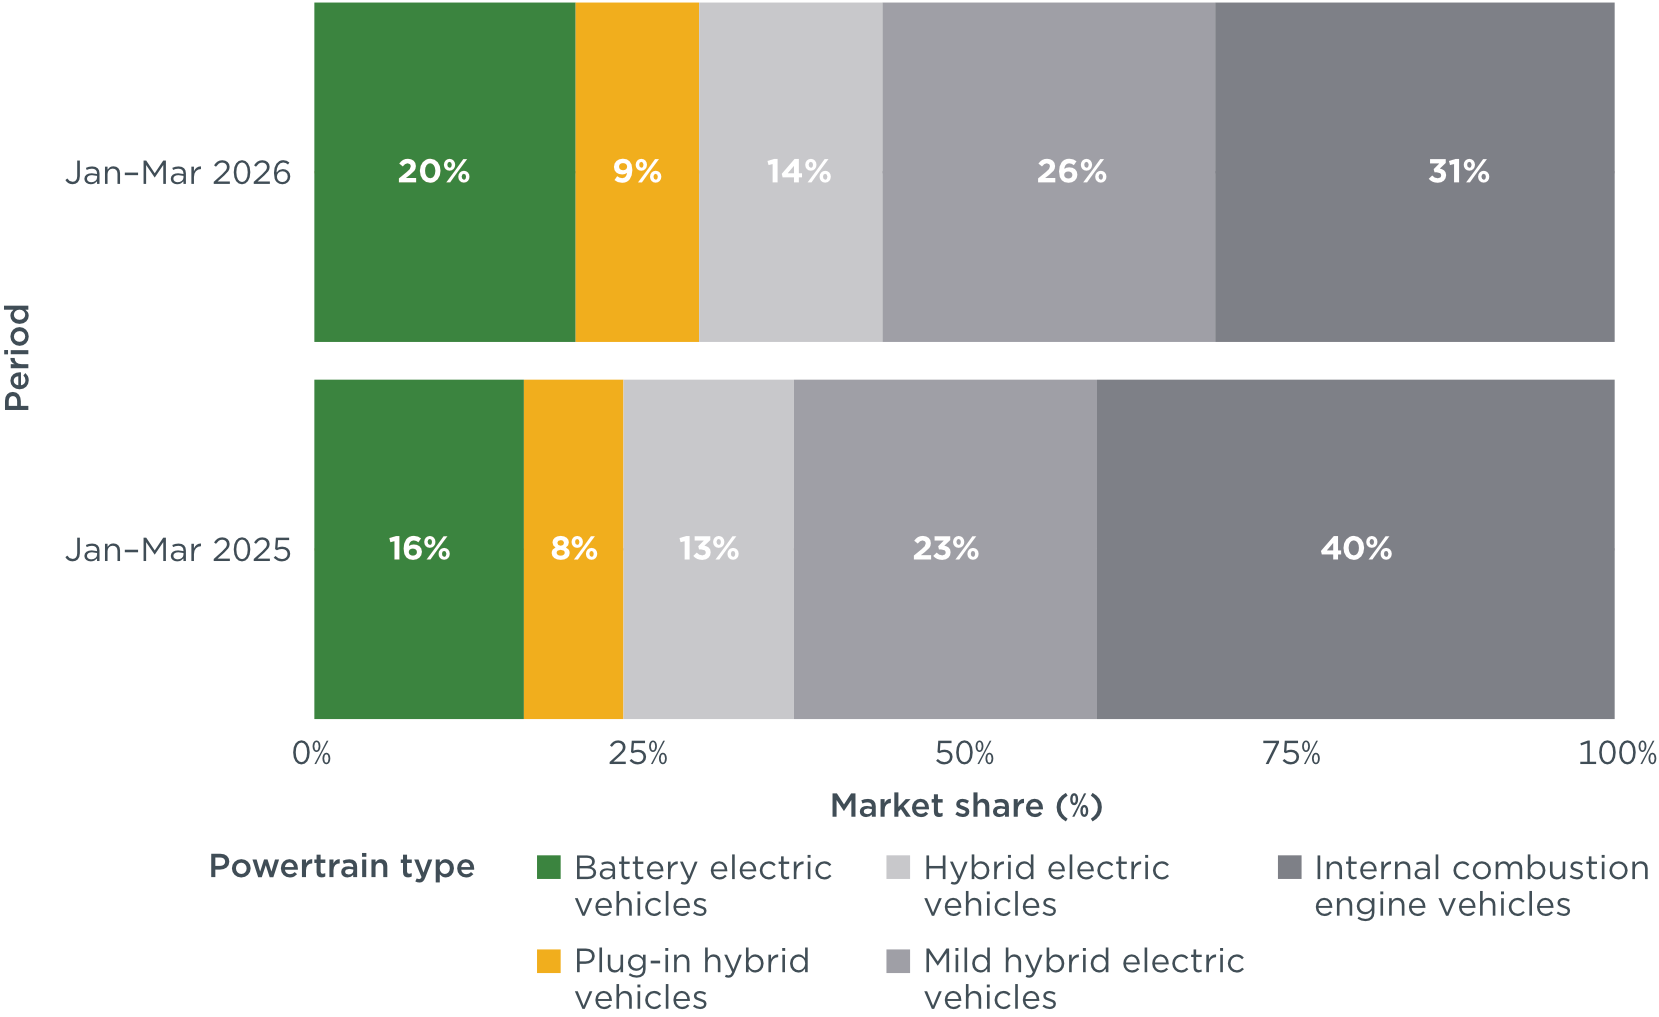
In January–March 2026, plug-in hybrid vehicles (PHEVs) had an average market share of 9% among new registrations in Europe, up 1 percentage point from January–March 2025.
Compared with the same period in 2025, full hybrid (HEVs) and mild hybrid electric vehicles (MHEVs) increased in market share by 1 and 3 percentage points, respectively, reaching shares of 14% and 26% in January–March 2026. Meanwhile, conventional internal combustion engine vehicles (ICEVs) comprised 31% of new registrations in January–March 2026. This is 9 percentage points lower than in the same period in 2025 (see Figure 2).
Figure 2
Europe’s new car market share by powertrain type, January-March 2024 versus January March 2025
Registrations increased in all of the 10 largest European markets, with Austria registering the biggest increase (+27%) in March 2026 compared with March 2025 (see Table A5 in the Appendix).
Looking at new BEV registrations in January–March 2026, Germany and Italy had BEV market shares of 23% and 8%, respectively. These represent increases of 6 and 3 percentage points compared with the same period in 2025.
France and Spain, the third and fourth largest markets, had increases of 10 and 2 percentage points, reaching BEV shares of 28% and 9%, respectively, in January–March 2026.
Nordic countries led Europe’s battery electric car registration shares in January–March 2026, with Norway and Denmark already reaching shares of 98% and 79%, respectively, followed by Finland (47%) and Sweden (41%) (Figure 3). Belgium (34%), Iceland (32%), the Netherlands (31%), France (28%), and Luxembourg (27%) all had BEV shares of 25% or greater. Also with BEV market shares above of the European average were Portugal (24%), Germany (23%), Austria (22%), and Ireland (21%). In January–March 2026, Denmark recorded the greatest increase in BEV market share compared with the same period in the previous year (+14 percentage points).
Figure 3
Europe’s new car market share by country and powertrain type, January–March 2026
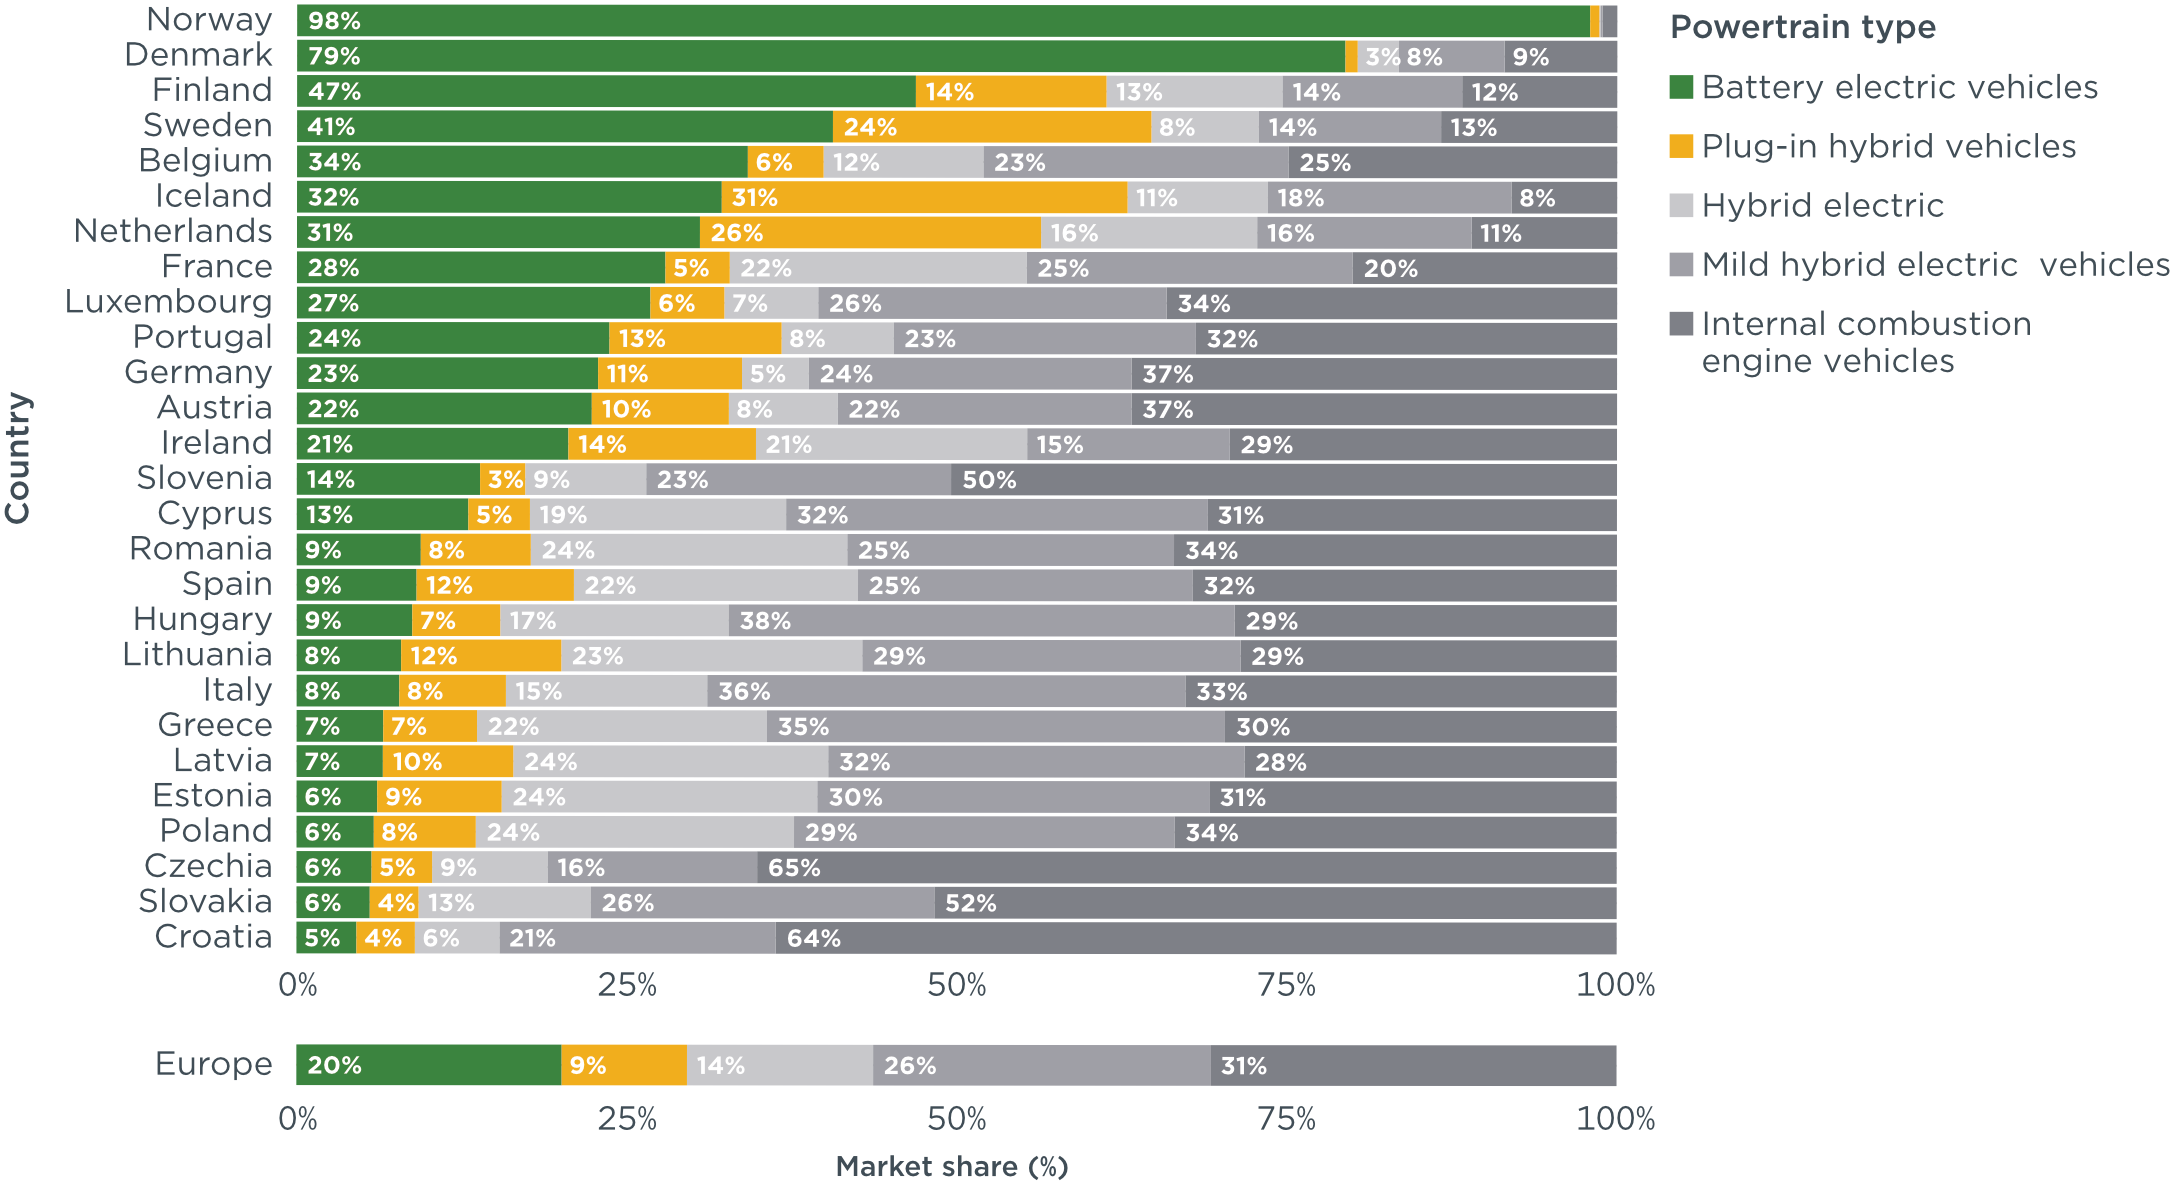
Looking at other drivetrains in the 10 largest European markets, PHEV shares were the highest in the Netherlands (26%) and Sweden (24%) in January–March 2026. Poland (24%), France (22%), and Spain (22%) had the highest HEV shares, while MHEV shares were the highest in Italy, at 36%, followed by Poland with 29%.
Under EU regulation, carmakers are required to reduce their CO₂ emissions from new cars incrementally through 2035. The current target value applies for each year from 2025 to 2029. However, compliance with the targets will first be assessed at the end of 2027 and will consider average CO₂ emissions for new car fleets from the 2025–2027 period. Automakers are permitted to combine their emissions performance across these 3 years through pooling arrangements (manufacturing pools) and may use compliance credits earned by selling zero- and low-emission vehicles (ZLEVs) as well as by deploying eco-innovations (i.e., technologies that deliver real-world CO₂ savings beyond what is measured over the standardized test cycle during type approval). Increasing the share of battery electric cars is the leading strategy used by manufacturers to achieve these reductions and avoid penalties.
In January–March 2026, manufacturer CO₂ emissions averaged 97 g CO₂/km. After accounting for compliance credits, manufacturers were, on average, 3 g CO₂/km above the 2026 target (see Table A2 of the Appendix). For the full reporting period from January 2025 to March 2026, adjusted emissions stood at 97 g CO₂/km. Including compliance credits, manufacturing pools thus remained 3 g CO₂/km short of the average target of 93 g CO₂/km for the 2025–2027 period, unchanged from the target gap recorded in 2025 (see Table A3 in the Appendix).
For the full January 2025–March 2026 reporting period, the BYD pool (33 g CO₂/km below), Nissan (8 g CO₂/km below), the Tesla and BMW pools (each 2 g CO₂/km below), and the Mercedes-Benz pool (at target) were all on track to meeting their 2025–2027 targets, while the Volkswagen pool (+7 g CO₂/km) remained the farthest from its target (see Figure 4).
Figure 4
Average distance to 2025–2027 CO2 targets for manufacturer pools and individual manufacturers
The Tesla and BYD pools had the largest BEV registration shares in March 2026, at 46% and 39%, respectively. The Mercedes-Benz (29%), BMW (28%), and Kia (23%) pools also had shares above the European average of 21%. Nissan (6%), the Toyota pool (9%), and SAIC (9%) had the lowest BEV shares in March (see Table A1 in the Appendix)
Looking at individual car brands with market shares of 1% or greater, Tesla and BYD had the greatest over-compliance at 92 g CO₂/km and 79 g CO₂/km, respectively, below their projected brand-level average targets for 2025–2027, followed by Volvo (29 g CO₂/km below), Mini (18 g CO₂/km below), and Cupra (17 g CO₂/km below). The brands with the largest target gaps were Nissan (28 g CO₂/km above), SEAT (24 g CO₂/km above), Mercedes-Benz (20 g CO₂/km above), and Mazda (19 g CO₂/km above; see Table A4 of the Appendix).
Among the largest carmakers, the Hyundai and Toyota groups had the greatest increase in BEV market share in January–March 2026, increasing 4 percentage points each compared with January–March 2025 (Table 1). With a 26% market share in March 2026, the Volkswagen Group increased its PHEV share by 4 percentage points over the same period in 2025.
Table 1
Share of battery electric and plug-in hybrid cars for the top seven manufacturer groups, January–March 2026
| Manufacturer group | Battery electric car share | Plug-in hybrid car share | Market share Jan–Mar 2026 | ||
| Jan–Mar 2026 | Change vs. Jan–Mar 2025 | Jan–Mar 2026 | Change vs. Jan–Mar 2025 | ||
| BMW Group | 26% | +1 pp | 14% | 0 pp | 7% |
| Hyundai Group | 22% | +4 pp | 5% | -1 pp | 7% |
| Mercedes-Benz Group | 20% | +3 pp | 19% | +1 pp | 5% |
| Volkswagen Group | 19% | +1 pp | 12% | +4 pp | 26% |
| Renault Group | 16% | +3 pp | 1% | 0 pp | 10% |
| Stellantis | 14% | +3 pp | 2% | +1 pp | 17% |
| Toyota Group | 8% | +4 pp | 6% | -2 pp | 7% |
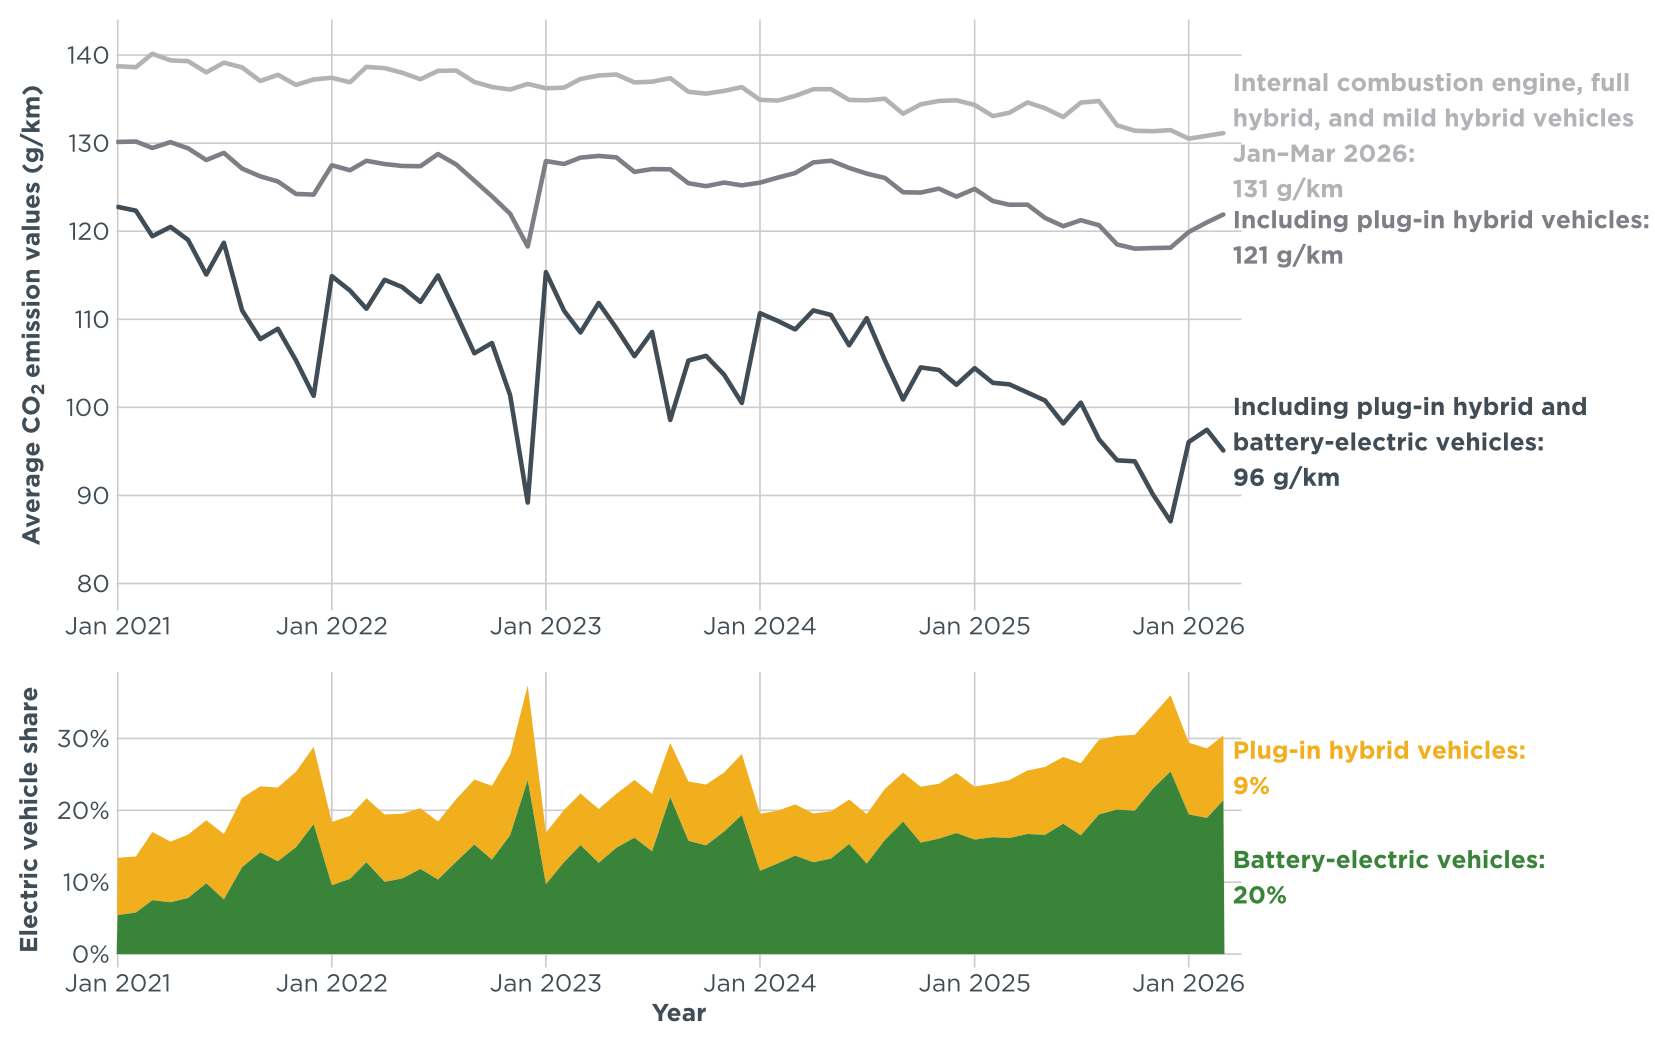
Of all powertrain types, battery electric cars have the largest potential to reduce total CO₂ emissions. When looking at new registrations of ICEVs (including HEVs and MHEVs) alone, CO₂ emissions averaged 131 g CO₂/km in January–March 2026. Including PHEVs reduced the average to 121 g CO₂/km, while the increasing market share of BEVs reduced average CO₂ emissions by an additional 25 g CO₂/km in January–March (see Figure 5).
Figure 5
Average CO₂ emissions of newly registered internal combustion engine vehicles and fleet-average reductions associated with including electrified powertrains
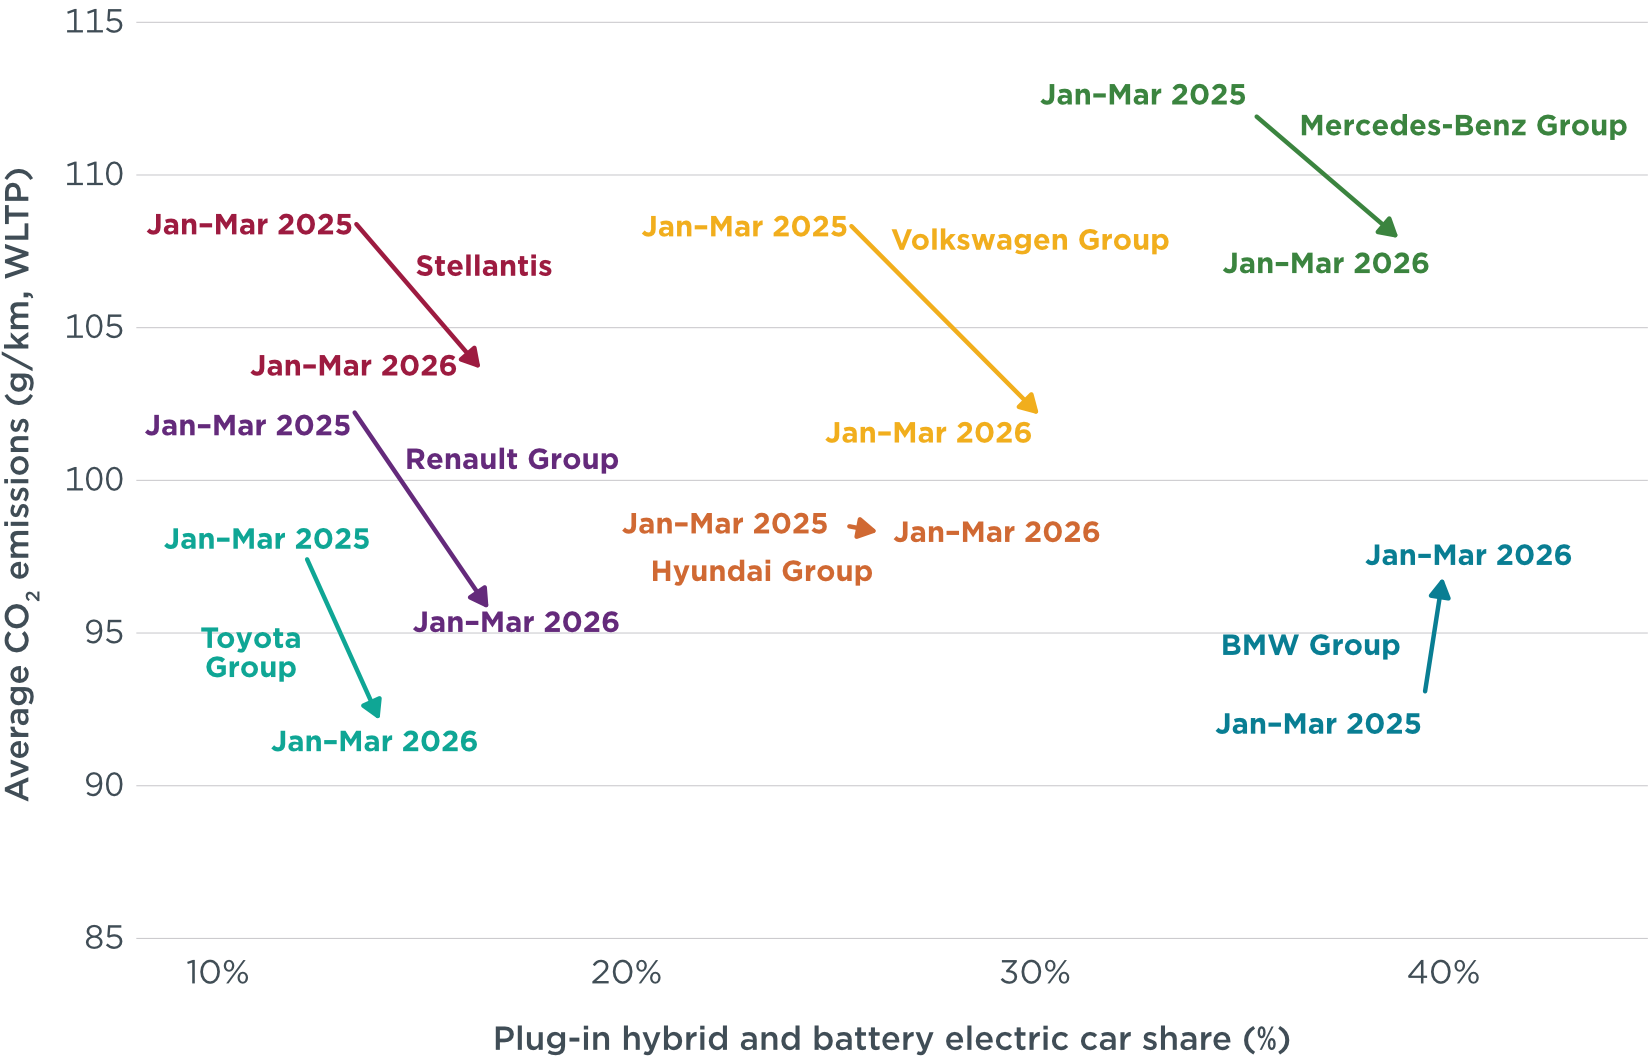
Looking at the relationship between electric car shares and average CO₂ emissions, the Mercedes-Benz group had the highest average emissions of the top manufacturers in Europe while having the second highest share of PHEVs and BEVs in January–March of 2025 and 2026. This was largely due to the high average CO₂ emissions of the group’s non-electrified powertrains, which stood at about 163 g CO₂/km in January–March 2026, the highest level among Europe’s largest carmaker groups. Although the BMW Group had consistently low fleet emissions in 2025, it has seen higher emissions in 2026. This disparity is due to an increase in recorded PHEV emissions to more realistic levels resulting from the European Commission correction of the electric driving share assumed for type-approval. With its focus on hybrid powertrains, Toyota had average CO2 emissions below its 2026 target in January–March despite maintaining the lowest electric vehicle share (see Figure 6).
Figure 6
Fleet-average CO₂ emissions compared with electric vehicle share by manufacturer group, January–March 2026 versus January–March 2025
The deployment of public charging infrastructure is expanding steadily in Europe. About 1.17 million public charging points had been installed in Europe by the end of the first quarter (Q1) of 2026, up from around 989,000 at the end of Q1 2025. For alternating current (AC) charging, this represents a 15% increase since the end of Q1 2025. Direct current (DC) charging points showed even greater growth, increasing 31% since the end of Q1 2025. Approximately 79% of Europe’s public charging points supply AC, while the remaining 21% supply DC. Among the 10 markets with the highest number of installed chargers, Belgium recorded the largest growth in DC chargers by the end of Q1 2026 (+43%) compared with the end of Q1 2025, followed by Italy (+40%) and Denmark (+38%). At +28%, Belgium also saw the largest growth in AC chargers. Although AC charging points generally outnumbered DC charging points in nearly all countries, Norway had nearly equal shares of both (Table 2).
Table 2
Number of publicly accessible charging points installed by country and type of power output
| Country | End of Q1/2026 | vs. end of Q1/2025 | ||
| AC | DC | AC | DC | |
| Netherlands | 209,211 | 8,252 | 14% | 33% |
| Germany | 157,253 | 56,454 | 20% | 30% |
| France | 129,625 | 43,217 | 9% | 22% |
| Belgium | 101,998 | 8,252 | 28% | 43% |
| Italy | 62,883 | 20,276 | 14% | 40% |
| Sweden | 55,493 | 12,424 | 16% | 28% |
| Spain | 38,932 | 16,487 | 13% | 27% |
| Denmark | 43,549 | 9,469 | 21% | 38% |
| Austria | 26,896 | 10,457 | 0% | 27% |
| Norway | 15,717 | 14,391 | -10% | 11% |
| Other | 81,203 | 47,398 | 20% | 45% |
| Total | 922,760 | 247,077 | 15% | 31% |
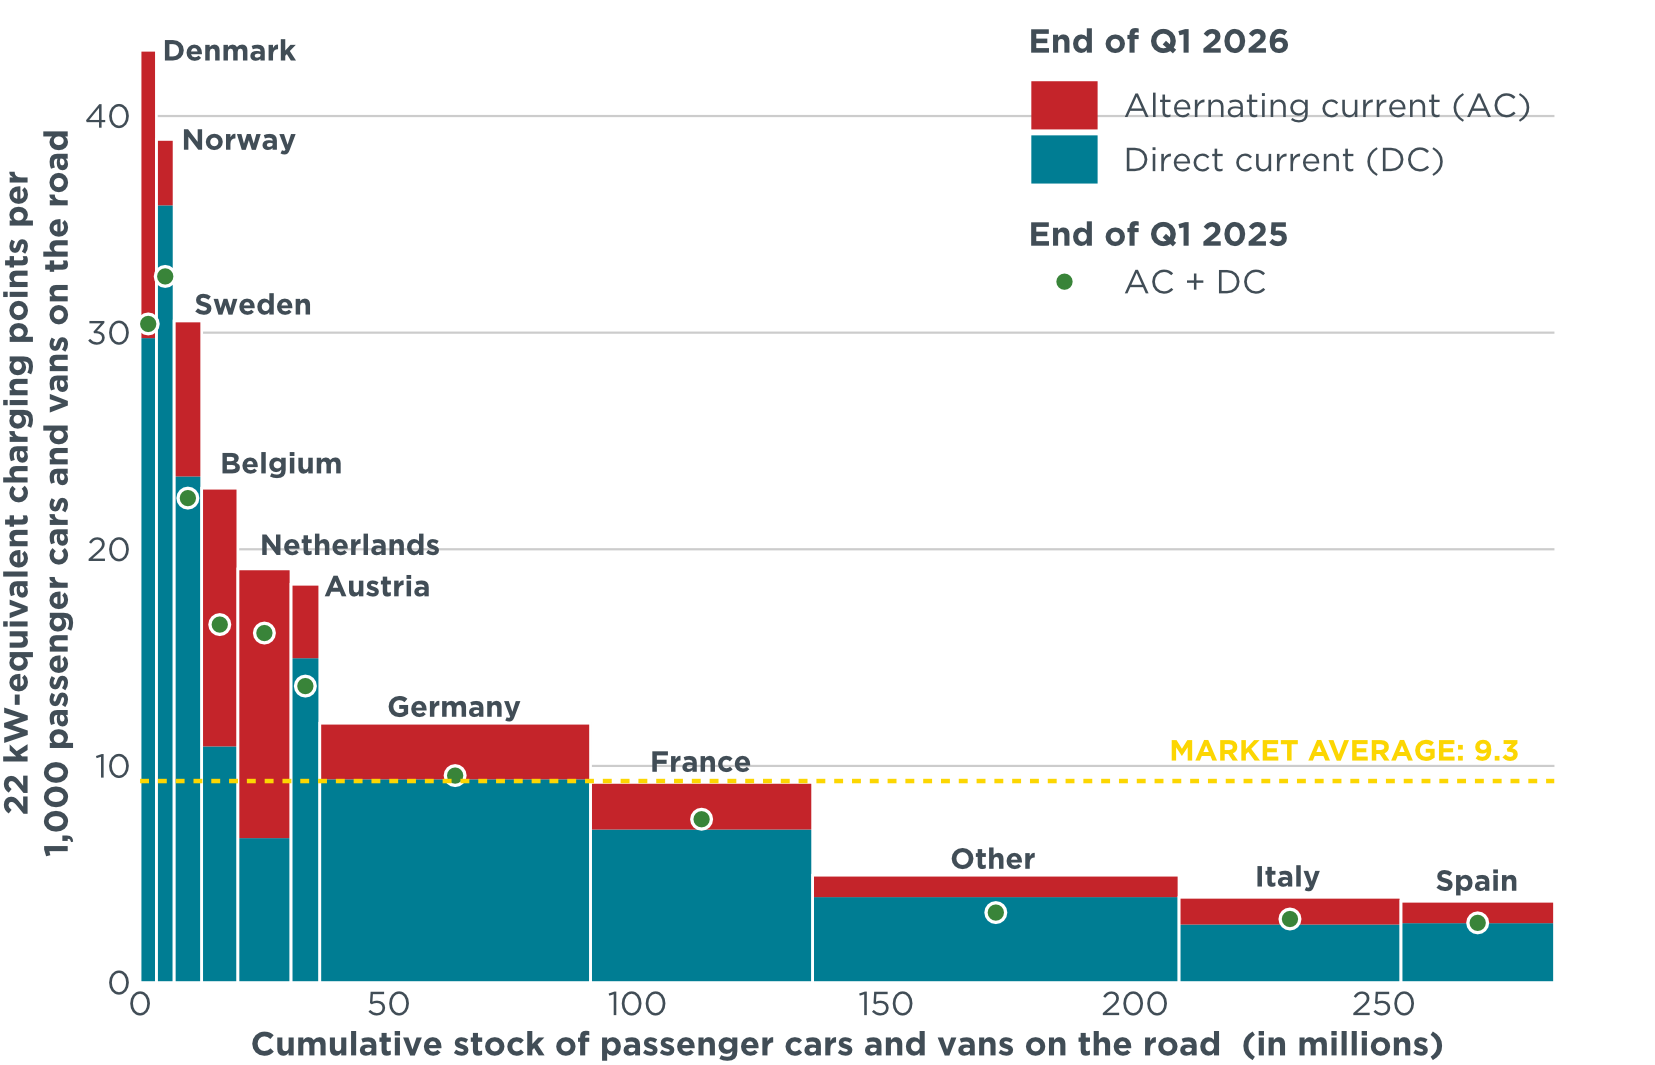
Figure 7
22 kW-equivalent publicly accessible charging points installed per thousand passenger cars and vans, by type of power output and country by the end of the first quarter of 2026
The think tanks Agora Verkehrswende (Germany), alinnea (Spain), ECCO Climate (Italy), the International Council on Clean Transportation (ICCT), the Mobility in Transition Institute (IDDRI-IMT, France), and the Polish Association for New Mobility (PSNM, Poland) publish monthly data on the average specific emissions of newly registered vehicle fleets in the European Economic Area, both overall and by country.
These data make it possible to track manufacturers’ compliance gap with respect to the CO₂ reduction targets (Regulation 2019/631) set for the 2025–2027 period, as well as the reduction of CO₂ emissions from new vehicles through 2035.
alinnea provides the report data with a particular focus on Spain, the fourth-largest automotive market in Europe.