29% of new vehicles registered in Europe in August 2026 were battery electric vehicles. This brought the average share for January–August 2026 to 23%, an increase of 6 percentage points, or 41%, compared with the same period in 2025.[1] Meanwhile, the market share of plug-in hybrid passenger cars increased by 1 percentage point, reaching 10%.
Registrations of conventional internal combustion engine passenger cars fell by 9 percentage points, to a market share of 29% in January–August 2026, while mild hybrids and full hybrids increased their shares to 24% and 14%, respectively, representing an increase of 1 percentage point for each vehicle type.
Germany and France, Europe’s largest passenger car markets, recorded battery electric market shares of 27% and 30%, respectively, representing increases of 9 and 12 percentage points compared with January–August 2025.
Italy, Europe’s third-largest market, recorded growth, with a battery electric share of 8%, 3 percentage points higher than in January–August 2025. In Poland, Europe’s fifth-largest market, the market share fell by 1 percentage point, to 5%.
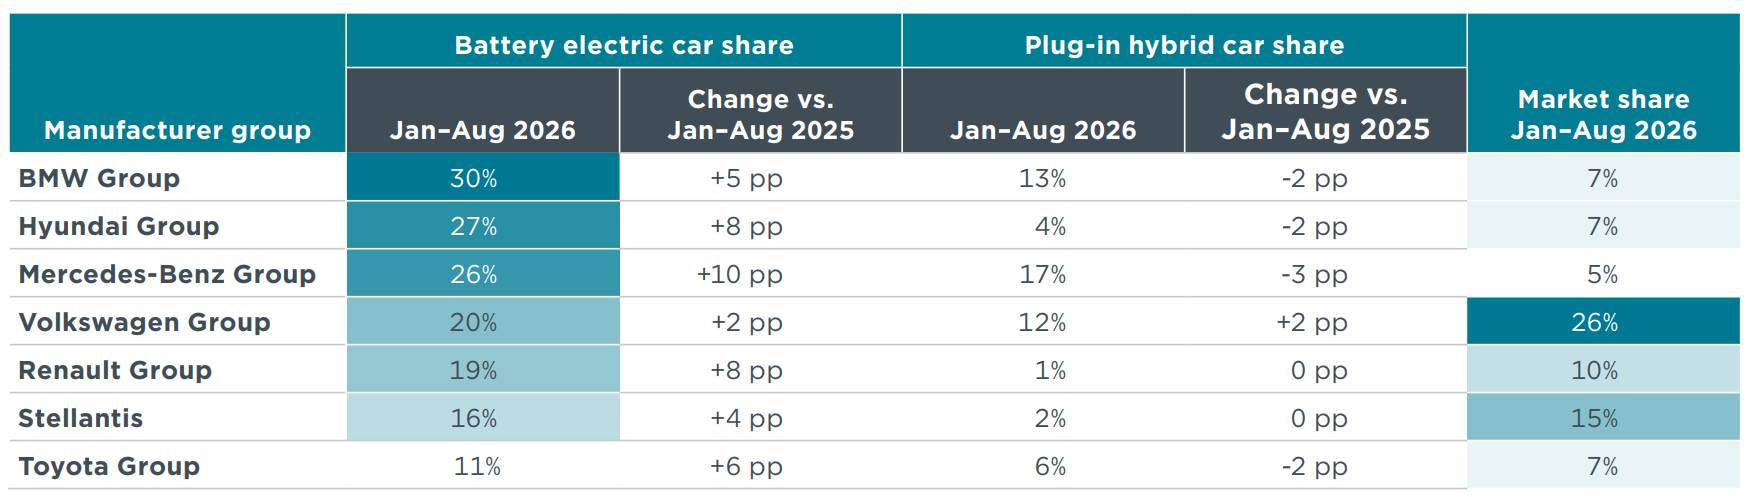
Among the seven largest car manufacturers in Europe, the BMW Group recorded the highest share of battery electric passenger cars in January–August 2026, at 30%. The Mercedes-Benz Group recorded a 10-percentage-point increase in its share of battery electric passenger cars compared with January–August 2025, while the Hyundai and Renault groups recorded increases of 8 percentage points. Toyota more than doubled its share, from 5% to 11%.
Overall BEV shares in new passenger car registrations by companies in several European countries already meet or are approaching the 2030 targets of the 2025 proposed Clean Corporate Vehicles Regulation (CCVR), which would apply only to large companies. This follows notable increases in BEV shares in January–August 2026 compared with the same period in 2025. In France, the only country with data available by company size, the average BEV share among large companies reached 43% in January–August 2026, only two percentage points below the proposed CCVR target for 2030 of 45%.
Spanish market
Spain, Europe’s fourth-largest market, also grew. The market share of battery electric vehicles (BEVs) reached 10% between January and August 2026, two percentage points higher than in the same period in 2025. In August 2026, the monthly BEV share reached 13%, with 9,452 units (+32% compared with August 2025). So far this year, 85,369 BEVs have been registered, 34% more.
Plug-in hybrid vehicles (PHEVs) recorded 105,396 registrations between January and August 2026, 35% more than the previous year, and reached a 13% share (compared with 10% in 2025). In August, their monthly share was 14%, with 10,069 units (+24%). Together, electric and plug-in hybrid vehicles already account for 23% of new registrations in Spain so far this year, five points more than in 2025. In August, they reached 27%.
Conventional hybrids (HEVs) grew more than any other type: 182,795 units (+36%) and a 22% share, five points more than in 2025. This is one of the highest shares among the ten largest European markets, together with Poland (24%) and France (21%). In August, HEVs increased by 43% and reached 24% of the market. Mild hybrids (MHEVs) maintained a 24% share, with 203,255 registrations (+10%).
In total, the Spanish market recorded 836,850 passenger cars between January and August 2026, 6% more than in the same period in 2025. In August alone, 70,374 passenger cars were registered (+12%).
CO2 emissions from the sector
In the period between January 2025 and August 2026, manufacturer pools were, on average, meeting the carbon dioxide (CO2) emissions target for 2025–2027.
¹ Geographical scope: To the extent permitted by the available data, the definition of Europe used in the ICCT Market Monitor reports is aligned with EU regulations. European CO₂ standards for passenger cars and vans apply to the countries of the European Economic Area (EEA), with the exception of Liechtenstein. This includes the 27 Member States of the European Union, as well as Iceland and Norway.
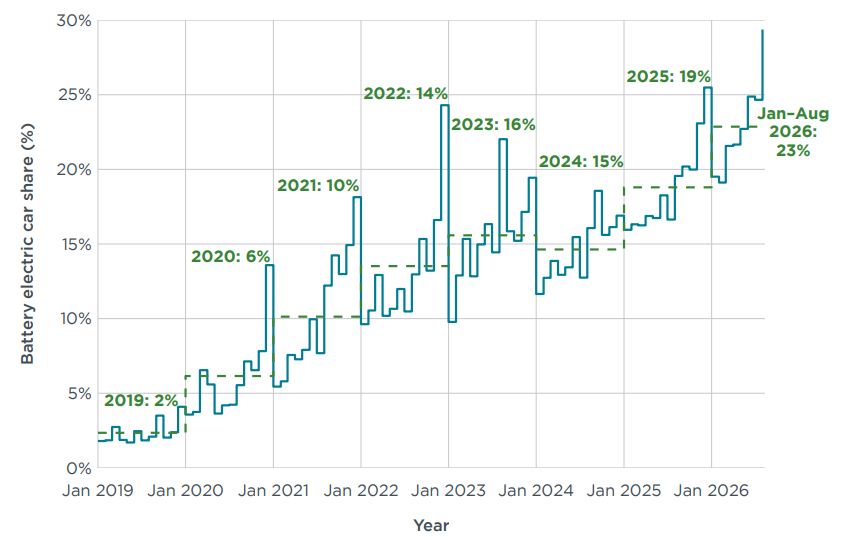
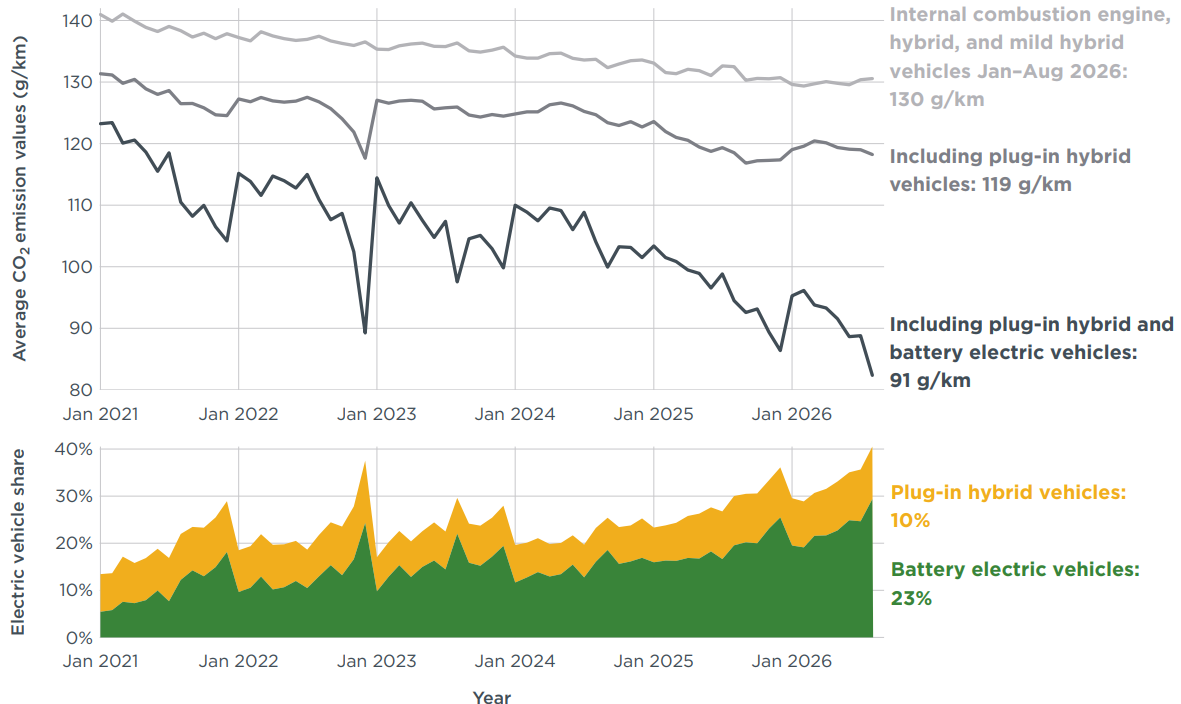
In August 2026, new battery electric vehicle (BEV) registrations made up 29% of all newly registered vehicles. This brought the average share of BEVs among total new registrations in Europe to 23% in January–August 2026, surpassing the 2025 average by 4 percentage points and marking a 6-percentage-point or 41% increase compared with the same period in 2025 (see Figure 1). The market share of plug-in hybrid vehicles (PHEVs) averaged 10% for January–August 2026
Figure 1
Share of battery electric vehicles among new passenger car registrations in Europe
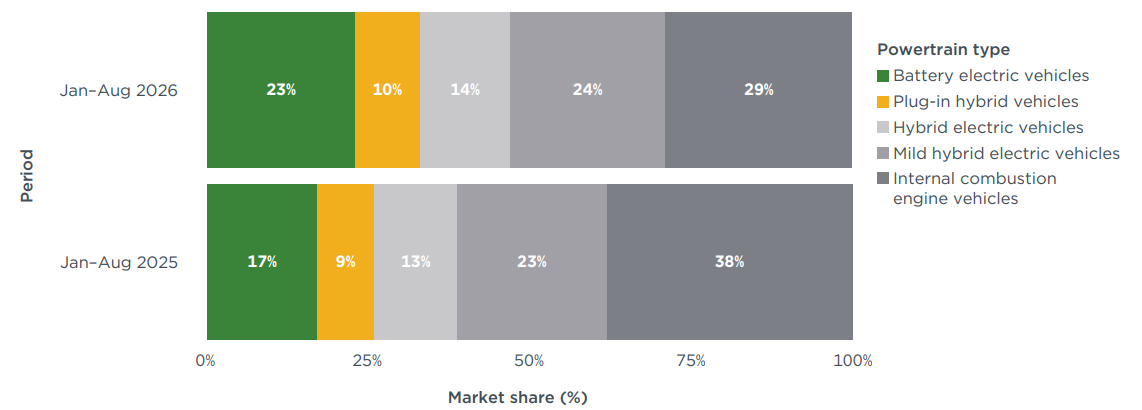
Compared with the same period in 2025, full hybrid electric vehicles (HEVs) and mild hybrid electric vehicles (MHEVs) increased in market share by 1 percentage point each, respectively, reaching shares of 14% and 24% in January–August 2026. Meanwhile, conventional internal combustion engine vehicles (ICEVs) comprised 29% of new registrations in January–August 2026. This was 9 percentage points lower than the market share during the same period in 2025 (see Figure 2).
Figure 2
Europe’s new car market share by powertrain type, January–August 2026 versus January–August 2025
Compared with January–August 2025, total new registrations in January–August 2026 among the 10 largest European markets generally increased, with Austria (+12%) and Poland (+9%) recording the largest increases. Total new registrations decreased in the Netherlands (−4%) and Belgium (−1%; see Table A5 in the Appendix).
Looking at new BEV registrations in January–August 2026, Germany and France—Europe’s largest car markets—had BEV market shares of 27% and 30%, respectively. These represent increases of 9 and 12 percentage points, respectively, compared with the same period in 2025.
Italy and Spain, the third- and fourth-largest markets, had increases of 3 and 2 percentage points in January–August 2026, reaching BEV shares of 8% and 10%, respectively.
Nordic countries led Europe in BEV registration shares, with Norway and Denmark reaching shares of 98% and 81%, respectively, in January–August 2026, followed by Finland (50%), Iceland (47%) and Sweden (43%). The Netherlands (40%), Belgium (38%), France (30%), Luxembourg (30%), Germany (27%), Portugal (26%), Austria (25%), and Ireland (25%) all had BEV shares of 25% or more (Figure 3). In January–August 2026, Denmark recorded the highest growth of all countries in BEV market share (+16 percentage points) compared with the same period in 2025.
Figure 3
Europe’s new car market share by country and powertrain type, January–August 2026
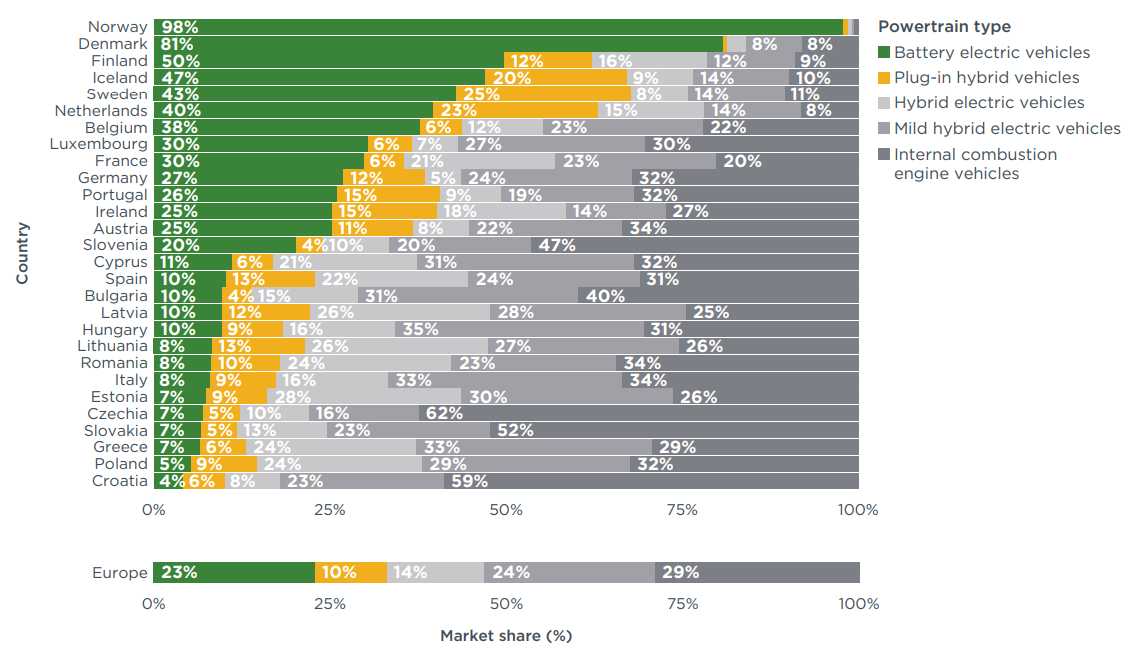
Looking at other powertrains in the 10 largest European markets, PHEV shares were the highest in Sweden (25%) and the Netherlands (23%) in January–August 2026. Poland (24%), Spain (22%) and France (21%) had the highest HEV shares, while MHEV shares were the highest in Italy, at 33%, followed by Poland with 29%.
Under EU regulations, carmakers are required to reduce CO2 emissions from newcars incrementally through 2035. The current target value applies for each year from 2025 to 2029. However, compliance with the targets will first be assessed at the end of 2027 and will consider average CO2 emissions for new car fleets over the 2025–2027 period. Automakers are permitted to combine their emissions performance across these 3 years through pooling arrangements (manufacturing pools) and may use compliance credits earned by selling zero- and low-emission vehicles (ZLEVs) as well as by deploying eco-innovations (i.e., technologies that deliver real-world CO2 savings beyond what is measured over the standardized test cycle during type approval). Increasing the share of battery electric cars is the leading strategy used by manufacturers to achieve these reductions and avoid penalties.
In January–August 2026, manufacturer CO2 emissions averaged 92 g CO2/km, excluding eco-innovation credits. After accounting for eco-innovation credits, manufacturers were, on average, in compliance with their 2026 targets (see Table A2 of the Appendix). The average 2026 target was 93 g CO2/km, 1 g CO2/km higher than the reference target before accounting for the ZLEV factor. For the full reporting period from January 2025 to August 2026, adjusted emissions stood at 93 g CO2/km. The average target for the 2025–2027 period was also 93 g CO₂/km after accounting for the ZLEV factor flexibility. Manufacturer pools were thus, on average, also meeting the target for the 2025–2027 period (see Table A3 in the Appendix).
For the full January 2025–August 2026 reporting period, the BYD pool (46 g CO2/km below), the Tesla pool (8 g CO2/km below), Nissan and the Kia pool (each 4 g CO2/km below), Mercedes-Benz, Porsche, BMW and Toyota pools (each 3 g CO2/km below), and Renault pool (at target) were all on track to meet their 2025–2027 targets. Together, these pools accounted for nearly half of new registrations in January–August 2026. The Volkswagen pool, which accounted for the largest market share (26%), remained the furthest from its target, exceeding it by 6 g CO2/km.
Figure 4
Average distance to 2025–2027 CO2 targets for manufacturer pools and individual manufacturers
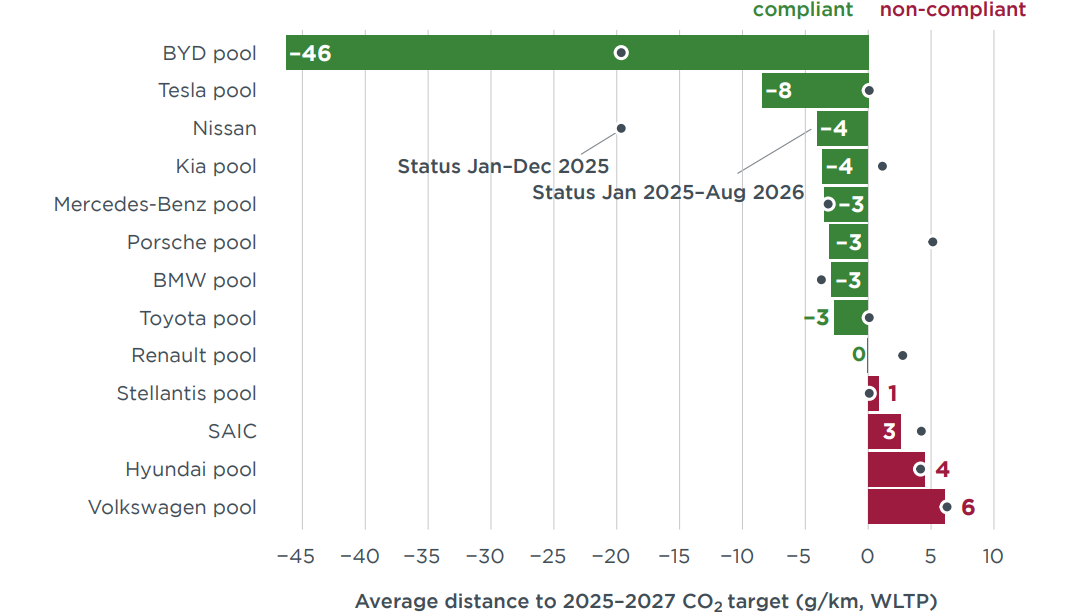
Note: Emission values include compliance credits. All CO2 values are estimates according to the Worldwide harmonized Light vehicles Test Procedure (WLTP). Only individual manufacturers with at least 1% market share in 2025 are shown. See the section on definitions, data sources, methodology, and assumptions for more information.
The Porsche and Kia pools had the largest BEV registration shares in August 2026, at 76% and 44%, respectively. The Tesla (42%), Mercedes-Benz (40%), BMW (38%), and BYD (36%) pools also had shares above the European average of 29%. The Stellantis pool (22%) and Toyota pool (14%) had the lowest BEV shares in August (see Table A1 in the Appendix).
Looking at individual car brands with market shares of 1% or greater, Tesla and BYD had the greatest over-compliance at 92 g CO2/km and 73 g CO2/km, respectively, below their projected brand-level average targets for 2025–2027 at the end of August 2026, followed by Volvo (28 g CO2/km below), Mini (17 g CO2/km below), and Cupra (16 g CO2/km below). Nissan (25 g CO2/km above), SEAT (23 g CO2/km above), Mazda (21 g CO2/km above), Mercedes-Benz, Audi, and Dacia (each 14 g CO2/km above) had the largest target gaps (see Table A4 in the Appendix).
Among the largest carmakers, the BMW Group had the highest BEV share in January–August 2026 at 30%, up 5 percentage points compared with January–August 2025, while the Mercedes-Benz Group recorded the greatest growth (+10 percentage points). The Hyundai and Renault groups each recorded increases of 8 percentage points in their BEV shares, while the Toyota Group more than doubled its share from 5% to 11% (Table 1). The Volkswagen Group, with a 26% total market share in January–August 2026, increased its BEV and PHEV shares by 2 percentage points each relative to the same period in 2025, while the other carmakers recorded either declines or no changes in their PHEV shares.
Table 1
Share of battery electric and plug-in hybrid cars for the top seven manufacturer groups, January–August 2026.
Of all powertrain types, battery electric cars have the largest potential to reduce fleet average CO2 emissions². When looking at new registrations of ICEVs (including HEVs and MHEVs) alone, CO2 emissions averaged 130 g CO2/km in January–August 2026. Including PHEVs reduced the average to 119 g CO2/km, while the increasing market share of BEVs reduced average CO2 emissions by an additional 28 g CO2/km in January–August 2026 (see Figure 5).
Figure 5
Average CO2 emissions of newly registered internal combustion engine vehicles and fleet-average reductions associated with including electrified powertrains
² Marie Rajon Bernard et al., The EV Transition Check: Measuring Progress towards Zero-Emission for Passenger Cars in the European Union (International Council on Clean Transportation, 2025), https://theicct.org/publication/ev-transition-check-sep25/.
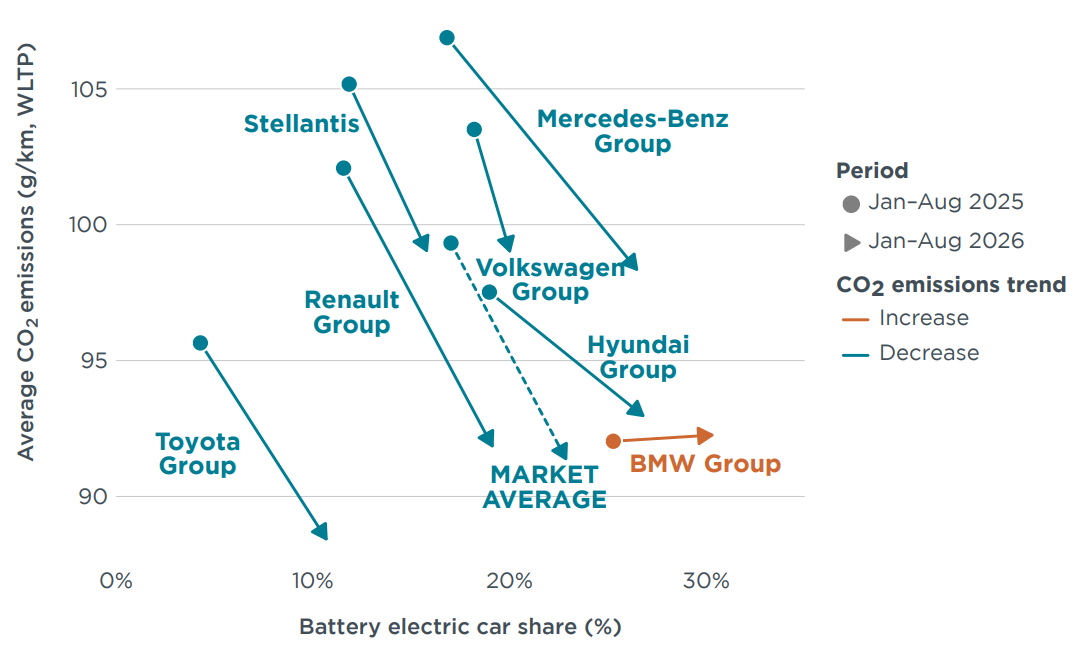
Looking at the relationship between electric car shares and average CO2 emissions in January–August 2026, the Mercedes-Benz Group stood out among the top manufacturers in Europe with some of the highest average emissions despite also having one of the highest shares of BEVs. This was largely driven by the high average CO2 emissions of the Group’s non-electrified powertrains, which stood at roughly 159 g CO2/km in January–August 2026, the highest level among Europe’s largest carmaker groups. In contrast, the Toyota Group, which has focused on hybrid powertrains, recorded average CO2 emissions below its 2026 target in January–August 2026 despite maintaining the lowest electric vehicle share.
Among Europe’s top manufacturers, BMW Group was the only manufacturing group to see an increase in emissions in January–August 2026 compared with the previous year. This reversal was partly due to a change in recorded PHEV emissions to more realistic levels resulting from the European Commission’s correction of the electric driving share assumed for type approval at the beginning of the year. However, it also mirrors a trend observed in previous CO2 target cycles: without interim annual targets, manufacturers often scale back CO2 reduction efforts once meeting their defined emissions target instead of using the momentum to reach the next target on a continuous reduction pathway (Figure 6)³.
Figure 6
Fleet-average CO2 emissions compared with battery electric vehicle share by manufacturer group, January–August 2026 versus January–August 2025
³ Sonsoles Díaz et al., CO₂ Emissions from New Passenger Cars in Europe: Car Manufacturers’ Performance in 2024 (International Council on Clean Transportation, 2025), https://theicct.org/publication/co2-emissions-from-new-passenger-cars-in-europe-car-manufacturers-performance-in-2024-dec25/.
Companies account for about 60% of new passenger car registrations in Europe4. Because these vehicles on average drive higher annual mileages and are replaced more frequently than privately owned cars, they can be a key lever for accelerating road transport decarbonization5. Yet BEV uptake among companies in Europe’s four largest car markets (Germany, Italy, France, and Spain) has generally lagged behind that of private buyers6 . To accelerate the transition to BEVs, the European Commission proposed the Clean Corporate Vehicles Regulation (CCVR) in December 2025, which sets binding targets for Member States to electrify vehicles in large companies7 to varying degrees by 2030 and 2035.8
Figure 7 shows the battery electric share of total company car registrations (across all company sizes) in January–August 2026 and January–August 2025 for nine selected countries (January–June for Belgium), comparing these shares with proposed zero-emission car targets for large companies for 2030 under the CCVR. Although the targets apply specifically to large companies, data for large companies alone is not widely available, so BEV shares across all company car registrations are used to provide a benchmark for overall progress. Year-on-year, company BEV shares increased in every country except Spain and Italy, where they remained unchanged. Belgium stood out with a BEV share of 59% in total new company car registrations in January–June 2026, slightly above the 2030 target of 58% set for large companies. Denmark, which also has a target of 58% by 2030, reached a company BEV share of 53% in January–August 2026, slightly below the proposed target. By contrast, Italy recorded a company BEV share of just 6% in January–August 2026, substantially below its proposed 45% target.
Figure 7
Battery electric share in new company car registrations (all company sizes) for nine selected European countries, January–August 2026 versus January–August 2025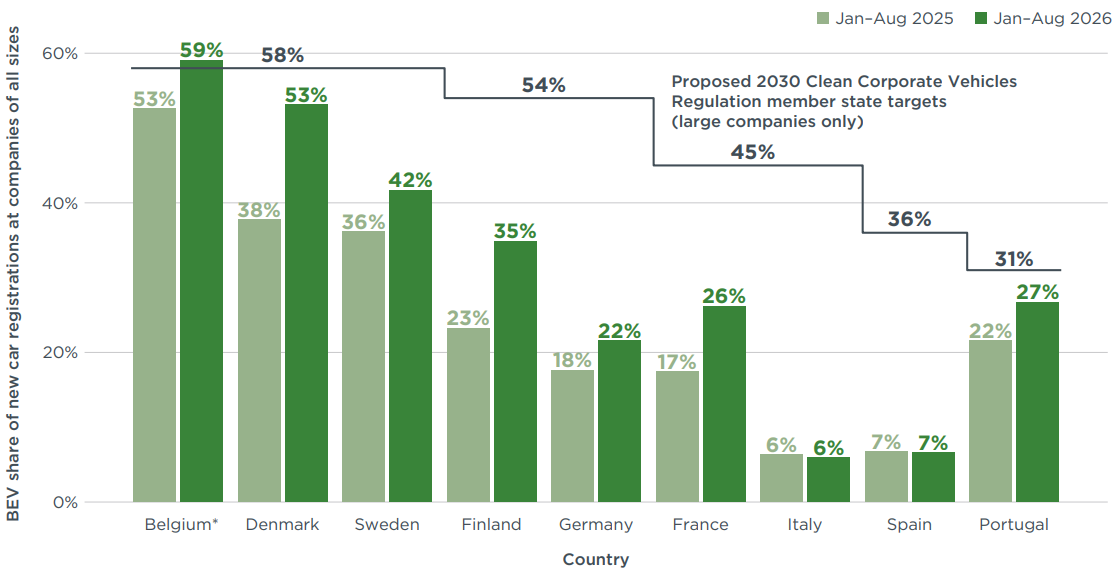
Note: Data for Belgium cover January–June only. Note: Proposed targets under the Clean Corporate Vehicles Regulation are calculated at the Member State level (for large companies only). For source information, see the section on definitions, data sources, methodology, and assumptions..
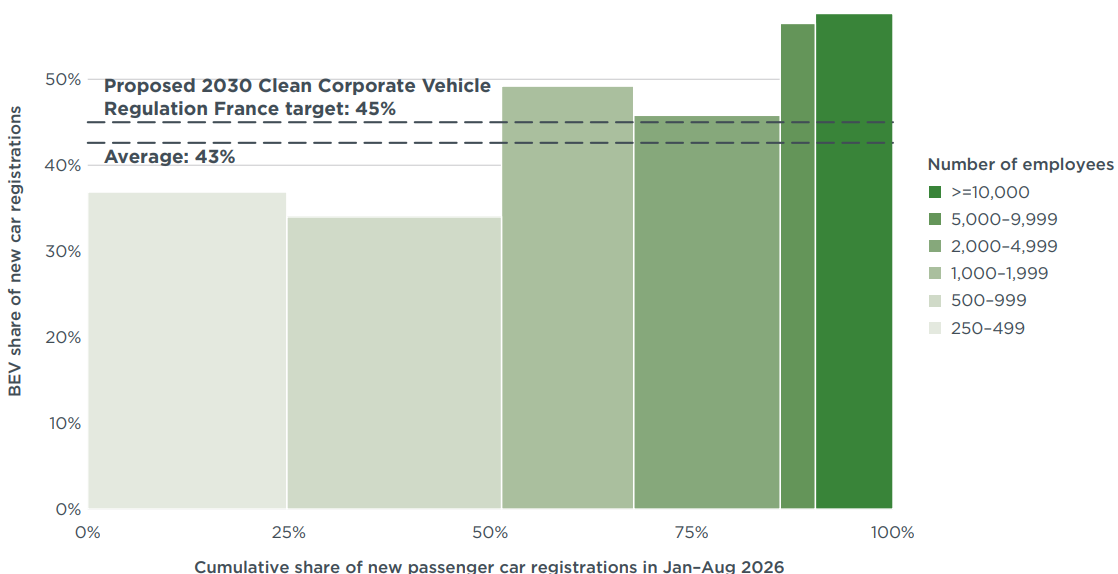
Looking at France, the BEV share reached 43% in January–August 2026 across all large companies (250+ employees), which is only two percentage points below the national 2030 CCVR proposed target of 45% (Figure 8). Companies with 1,000 or more employees, which accounted for about 50% of new car registrations by large companies in the same period, have already met the target, with average BEV shares between 49% and 58%.
The notably higher BEV shares for large companies compared with the overall company average in France (43% vs. 26% in January–August 2026), suggests that many countries may be closer to their proposed 2030 CCVR target than Figure 7 indicates.
Figura 8
Battery electric share of new car registrations among companies with 250+ employees by company-size band in France, January–August 2026
Note: Proposed targets under the Clean Corporate Vehicles Regulation are calculated at the Member State level (for large companies only). For source information, see the section on definitions, data sources, methodology, and assumptions.
4 The company registrations category includes all vehicles registered to legal entities that are no individuals, such as company fleets of any size, rental fleets, and dealers’ and manufacturers’ self-registrations; Sandra Wappelhorst, The European Union’s Proposal for a Clean Corporate Vehicles Regulation: Scope and Relevance for Germany (International Council on Clean Transportation, 2026), https://theicct.org/publication/eu-proposal-for-a-clean-corporate-vehicles-regulation-scope-and-relevance-for-germany-may26/.
5 Sandra Wappelhorst, The European Union’s Proposal.
6 Sandra Wappelhorst and Sonsoles Díaz, Decarbonization of Europe’s Corporate Fleet (International Council on Clean Transportation, 2025), https://theicct.org/publication/decarbonization-of-europes-corporate-fleet-oct25.
7 The CCVR uses a number of definitions to determine which registrations are included. A “corporate vehicle” is a vehicle registered by a legal entity rather than a private individual. Within this group, vehicle registrations focus on “large undertakings”, defined as undertakings meeting or exceeding at least two of the following criteria: 250 employees, a €25 million balance sheet total, or €50 million net turnover.
8 Proposal for a Regulation of the European Parliament and of the Council on Clean Corporate Vehicles, COM/2025/994 final, https://eur-lex.europa.eu/legal-content/EN/TXT/?uri=COM:2025:994:FIN.
The think tanks Agora Verkehrswende (Germany), alinnea (Spain), ECCO Climate (Italy), the International Council on Clean Transportation (ICCT), the Mobility in Transition Institute (IDDRI-IMT, France), and the Polish Association for New Mobility (PSNM, Poland) publish monthly data on the average specific emissions of newly registered vehicle fleets in the European Economic Area, both overall and by country.
These data make it possible to track manufacturers’ compliance gap with respect to the CO₂ reduction targets (Regulation 2019/631) set for the 2025–2027 period, as well as the reduction of CO₂ emissions from new vehicles through 2035.
alinnea provides the report data with a particular focus on Spain, the fourth-largest automotive market in Europe.





DEFINITIONS, DATA SOURCES, METHODOLOGY, AND ASSUMPTIONS
Manufacturer pools: Automakers are allowed to form pools to jointly comply with CO2 targets. For this publication, the pools are defined according to the European Commission’s “M1 pooling list” version from 18 May 2026 as well as the “Declarations of intent to form Open Pools” version from 5 August 2026 together with the assumptions outlined below. To date, two closed pools (the BMW and Hyundai pools) have been declared for 2025–2027.
In addition, two open pools (the Mercedes-Benz and Tesla pools) have been declared for 2026 and a third, the Porsche pool, has been declared for 2026–2027. For the purposes of this analysis, vehicle makes not part of the declared pools were assigned to manufacturers and grouped into closed pools based on patterns observed in the 2024 CO2 monitoring data published by the European Environment Agency. In general, all makes registered by a given manufacturer were consolidated within that manufacturer’s closed pool (e.g., the makes Renault and Dacia were both assigned to the Renault pool). Where two or more manufacturers registered vehicles under the same make, these manufacturers were considered to form a pool together (e.g., Automobiles Citroën and Stellantis Auto SAS both registered vehicles under the make Citroën and were grouped into the Stellantis pool). Where a single make was registered by a single manufacturer no pool was assumed (e.g., SAIC). In addition, it was assumed that all manufacturers belonging to the Volkswagen Group except Porsche formed a single closed pool. The main brands are: BMW pool (BMW, Mini), BYD pool (BYD), Hyundai pool (Hyundai), Kia pool (Kia), Mercedes-Benz pool (Mercedes-Benz, Polestar, Smart, Volvo), Porsche pool (Porsche, XPeng), Renault pool (Dacia, Renault), Stellantis pool (Citroën, Fiat, Jeep, Opel, Peugeot), Tesla pool (Ford, Honda, Mazda, Suzuki, Tesla), Toyota pool (Toyota), and Volkswagen pool (Audi, Cupra, SEAT, Škoda, VW). Nissan and SAIC are large passenger car manufacturers that are not part of a pool.Abbreviations: CO2 = carbon dioxide; g/km = grams per kilometer; SPV = special purpose vehicle; ZLEV = zero- and low-emission vehicle.
Technical scope: This publication focuses on new passenger car registrations. Battery electric vehicles (BEVs) are powered exclusively by an electric motor, with no additional source of propulsion. Plug-in hybrid electric vehicles (PHEVs) combine a conventional combustion engine with an electric propulsion system that can be recharged via an external power source. Hybrid electric vehicles include full hybrid electric vehicles (HEVs) and mild hybrid electric vehicles (MHEVs). HEVs and MHEVs integrate two propulsion systems, usually a combustion engine and an electric propulsion system that cannot be recharged via an external power source. Key differences between HEVs and MHEVs are the system voltage and system power. HEVs can operate using only electric power for limited periods, while the electric propulsion system of MHEVs is typically only capable of assisting the combustion engine. For more on HEVs and MHEVs, see: Jan Dornoff et al., Mild-Hybrid Vehicles: A Near Term Technology Trend for CO2 Emissions Reduction (International Council on Clean Transportation, 2022), https://theicct.org/publication/mild-hybrid-emissions-jul22/.
Special purpose vehicles: SPVs, such as motor caravans, ambulances, or wheelchair accessible vehicles, are outside the scope of the CO2 regulation for cars and vans. However, they were inadvertently included in the Market Monitor analyses up to and including the January–May 2026 report. Starting with the January–June 2026 report, SPVs have been excluded from the analysis. Their removal reduced estimated fleet-wide average 2026 CO2 emissions by about 1 g/km. At the make level, excluding SPVs reduced estimated 2026 CO2 emissions by a maximum of 2 g/km, with the exception of three makes that saw larger decreases: Fiat (with a decrease of 17 g CO2/km), Ford (a decrease of 7 g CO2/km), and Citroën (a decrease of 3 g CO2/km).
Geographic scope: The European CO2 regulation for vehicle manufacturers applies to all countries of the European Economic Area (EEA). This includes the 27 Member States of the European Union plus Iceland and Norway but excludes Liechtenstein. Data for new car registrations and shares of BEVs in this publication cover all of these countries, with the exception of Malta. Data on BEV market shares are also unavailable for Bulgaria. Data for CO2 emission levels additionally omit Bulgaria, Hungary, Romania, and Slovenia. In addition, August 2026 data are not available for Croatia, Portugal, and Sweden, and June 2026 data are not available for Sweden as well.
Data sources: Dataforce (new vehicle registrations) and European Environment Agency (vehicle mass and eco-innovation credits). Historical values are regularly updated to reflect the latest data available. Dataforce data used in the Market Monitor analyses may deviate from the official CO2 monitoring data published by the European Environment Agency. Data on corporate fleets were obtained from the following sources: Belgium: Fédération de l’Automobile et du Cycle en Belgique et au Grand-Duché du Luxembourg (FEBIAC); Denmark: Statistics Denmark—StatBank.dk/BIL53; Finland: Statistics Finland; France: C-Ways; Système d’Immatriculation des Véhicules (SIV); Germany: Kraftfahrt-Bundesamt, FZ 28, May 2026; DL-DE BY 2.0; figures based on own calculations; Italy: Unione Nazionale Rappresentanti Autoveicoli Esteri (UNRAE); Portugal: Associação Automóvel de Portugal (ACAP); Observatório da Mobilidade Elétrica; Spain: Dirección General de Tráfico, Microdatos de Matriculaciones de Vehículos (mensual), May 2026; Sweden: Transport Analysis.
Results may change over time: Registrations and/or CO2 data may be retrospectively updated by national type-approval authorities.
Test procedures: CO2 values are provided according to the Worldwide harmonized Light vehicles Test Procedure (WLTP).
Flexible compliance mechanisms: To facilitate meeting the CO2 targets, manufacturers can make use of a number of compliance mechanisms, including (1) eco-innovation technologies and (2) ZLEV factors. First, manufacturers can reduce their CO2 level by up to 6 g/km by deploying eco-innovation technologies. As a conservative estimate, we applied the 2025 level of eco-innovation CO2 emission reductions per brand to both 2025 and 2026 registrations. For more on the methodology used, see: Uwe Tietge et al., Overview and Evaluation of Eco-Innovations in European Passenger Car CO2 Standards (International Council on Clean Transportation, 2018), https://theicct.org/publications/eco-innovations-european-passenger-car-co2-standards. Second, if a manufacturer’s ZLEV share exceeds 25% (for cars) or 17% (for vans), its CO2 target is increased by the same number of percentage points, up to a maximum of 5%. This adjustment is referred to as the ZLEV factor, while the target before adjustment is called the manufacturer reference target. The manufacturer target is calculated by multiplying the reference target by the ZLEV factor. ZLEVs include BEVs and vehicles with CO2 emissions of 50 g/km or less (per WLTP). For details on the ZLEV factor mechanism, see: Jan Dornoff, CO2 Emission Standards for New Passenger Cars and Vans in the European Union (International Council on Clean Transportation, 2023), https://theicct.org/publication/eu-co2-standards-cars-vans-may23/.
Mass-based targets: For each manufacturer or manufacturer pool, a specific 2026 CO2 target value applies, depending on the average WLTP test mass of the new vehicles registered. For this publication, we assumed the average WLTP test mass per manufacturer remained the same as in 2025. The average 2025 BEV and non-BEV test mass for each manufacturer was calculated based on data from the European Environment Agency and then weighted according to their 2026 BEV market share. For more on the methodology used, see: Uwe Tietge et al., CO2 Emissions from New Passenger Cars in Europe: Car Manufacturers’ Performance in 2024 (International Council on Clean Transportation, 2025), https://theicct.org/publication/co2-emissions-from-new-passenger-cars-in-europe-car-manufacturers-performance-in-2024-dec25/.
2025–2027 averaging: Rather than an annual requirement to meet the CO2 target applying from 2025 onward, manufacturers were granted the flexibility to comply based on their average CO2 emissions over the 3-year period 2025–2027. This means that manufacturers may exceed their CO2 targets in 1 or more years, provided that any excess emissions are balanced out by equivalent over-compliance in other years within the averaging period. For more details on the provision, see: International Council on Clean Transportation, Public Comments on the European Commission Proposal to Introduce a 3-Year “Averaging” Provision for the CO2 Standards Regulation for New Cars and Vans (2025), https://theicct. org/icct-comments-on-the-european-commission-proposal-to-introduce-a-3-year-averaging-provision-for-the-co2-standards-regulation-for-new-cars-and-vans/.
- Company registrations: We define registrations by companies as any group of vehicles registered or leased by a legal entity instead of a private individual. Company registrations include vehicles from traditional company fleets, such as leasing and long-term rentals, public administration, and taxi and chauffeur services, as well as vehicles registered by car dealers and manufacturers and those operated by short-term rental companies. Company vehicle registration data used in this report also cover vehicles registered by individuals in their capacity as legal entities.