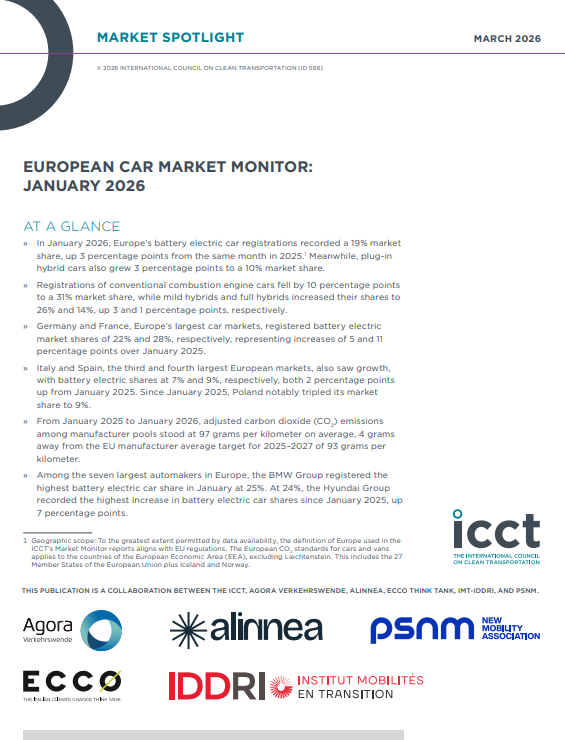
As the transition to zero-emission electrified mobility accelerates, monitoring developments in the automotive market becomes an important benchmark for assessing how manufacturers are adapting their strategies to meet increasingly stringent emissions reduction targets.
To provide reliable and up-to-date data to the public debate, the think tanks Agora Verkehrswende (Germany), alinnea (Spain), ECCO Climate (Italy), the International Council on Clean Transportation (ICCT), the Institute for Mobility in Transition (IDDRI-IMT, France), and the Polish New Mobility Association (PSNM) publish monthly data on the average specific emissions of newly registered vehicle fleets across the European Economic Area, both at the aggregate and country level.
These data make it possible to track manufacturers’ compliance gap with the CO₂ reduction targets set for the 2025-2027 period under Regulation (EU) 2019/631, as well as progress towards the reduction of CO₂ emissions from new vehicles through to 2035.
alinnea provides the report’s findings with a particular focus on Spain, Europe’s fourth-largest automotive market.
The monitoring also includes detailed registration data by powertrain type, covering battery electric vehicles (BEVs), plug-in hybrid electric vehicles (PHEVs), full hybrids (HEVs), and mild hybrids (MHEVs). In addition, it provides a quarterly update on developments in charging infrastructure, the production, purchase and registration of vans, and the uptake of corporate electric vehicles.
Through these regular updates, our aim is to provide a valuable resource for automotive manufacturers, analysts, public authorities, trade unions, and environmental organisations. In short, for all stakeholders involved in the transition to zero-emission mobility.
The European Car Market Monitor will be published each month on alinnea’s website and will be distributed to the media and to members of the alinnea Community involved in electric mobility.
The Spanish Market
CO₂ Emissions from the Sector
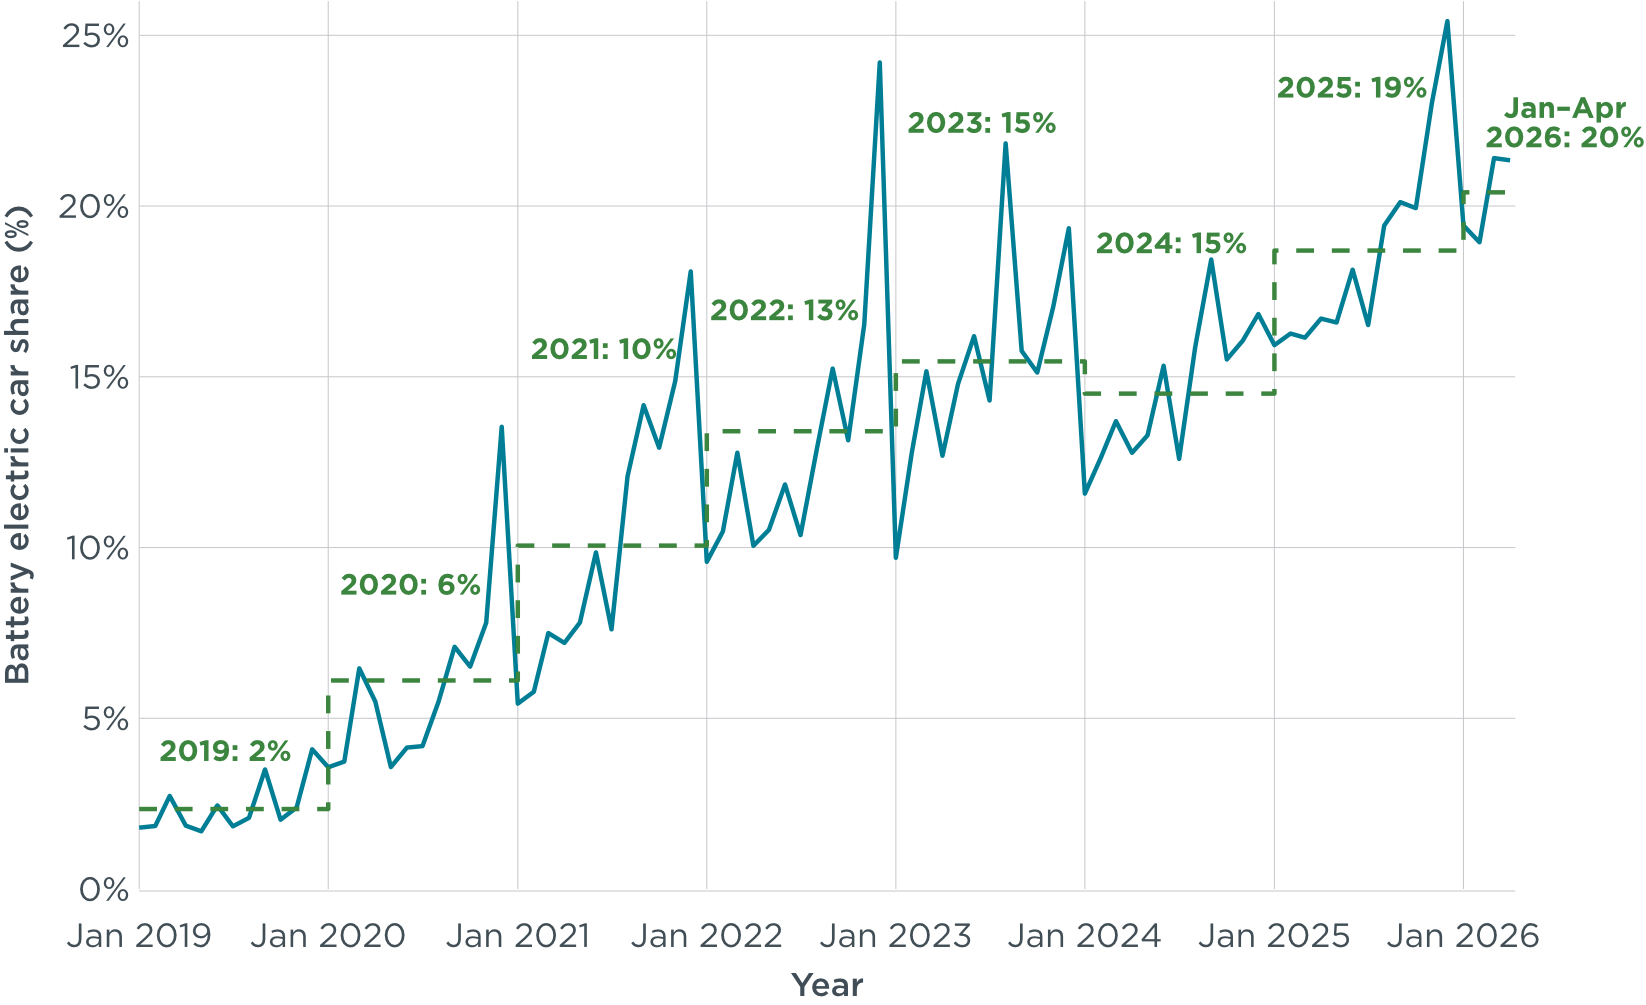
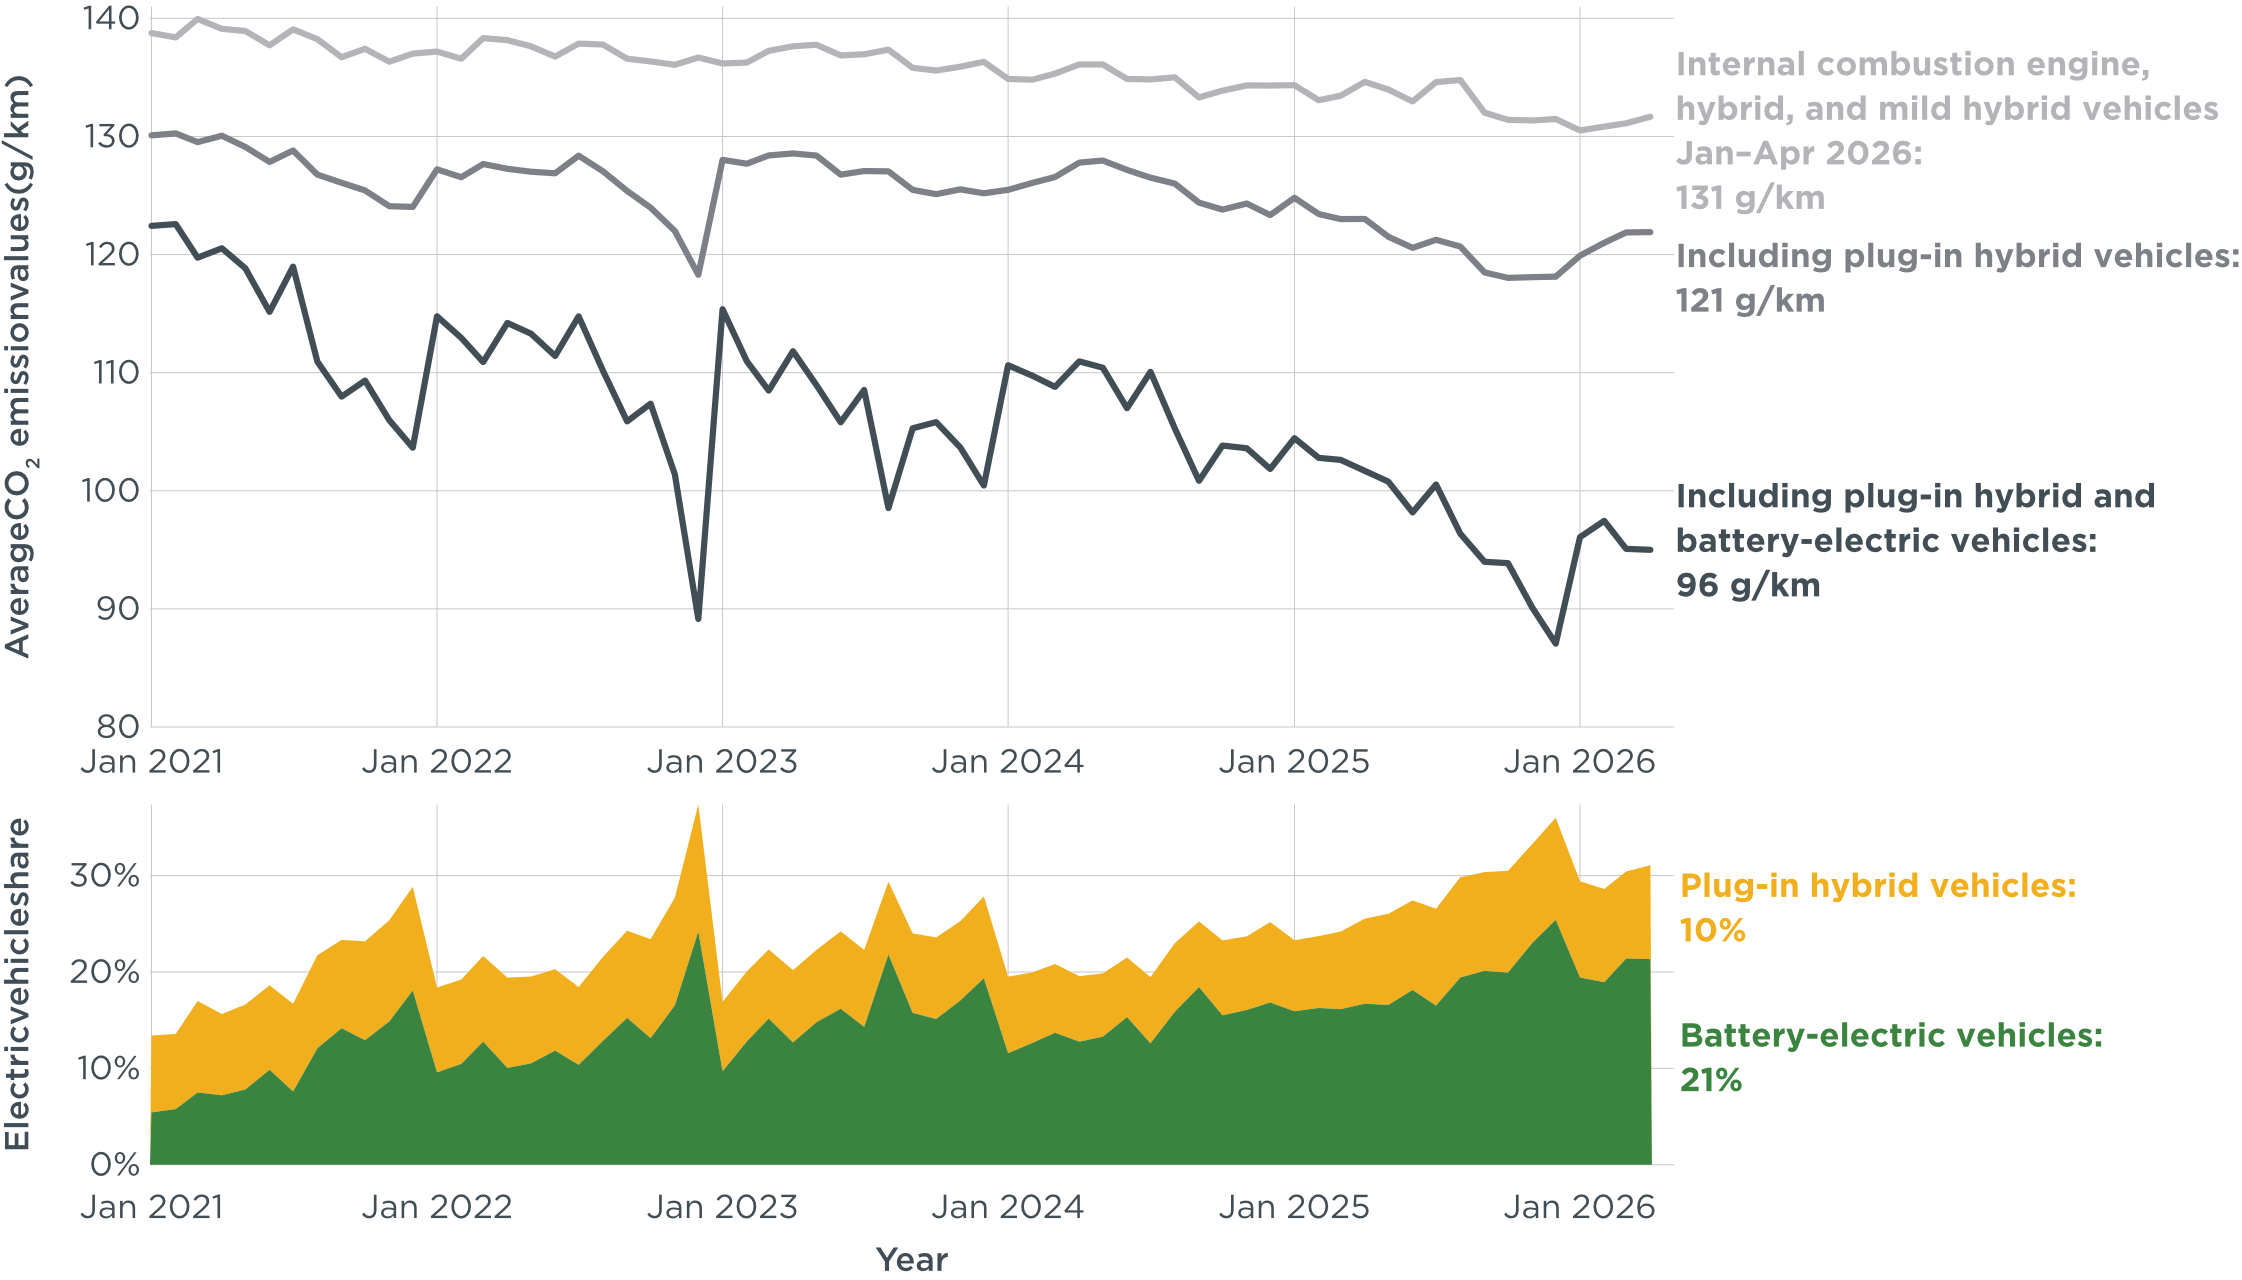
In April 2026, new battery electric car registrations reached a 21% market share out of all new registrations. This brought the average share of BEVs among total new registrations in Europe to 20% in January–April 2026, surpassing the 2025 average and marking a 4-percentage-point increase compared with the same period in 2025.
Figure 1
Share of battery electric vehicles in total new passenger car registrations in Europe.
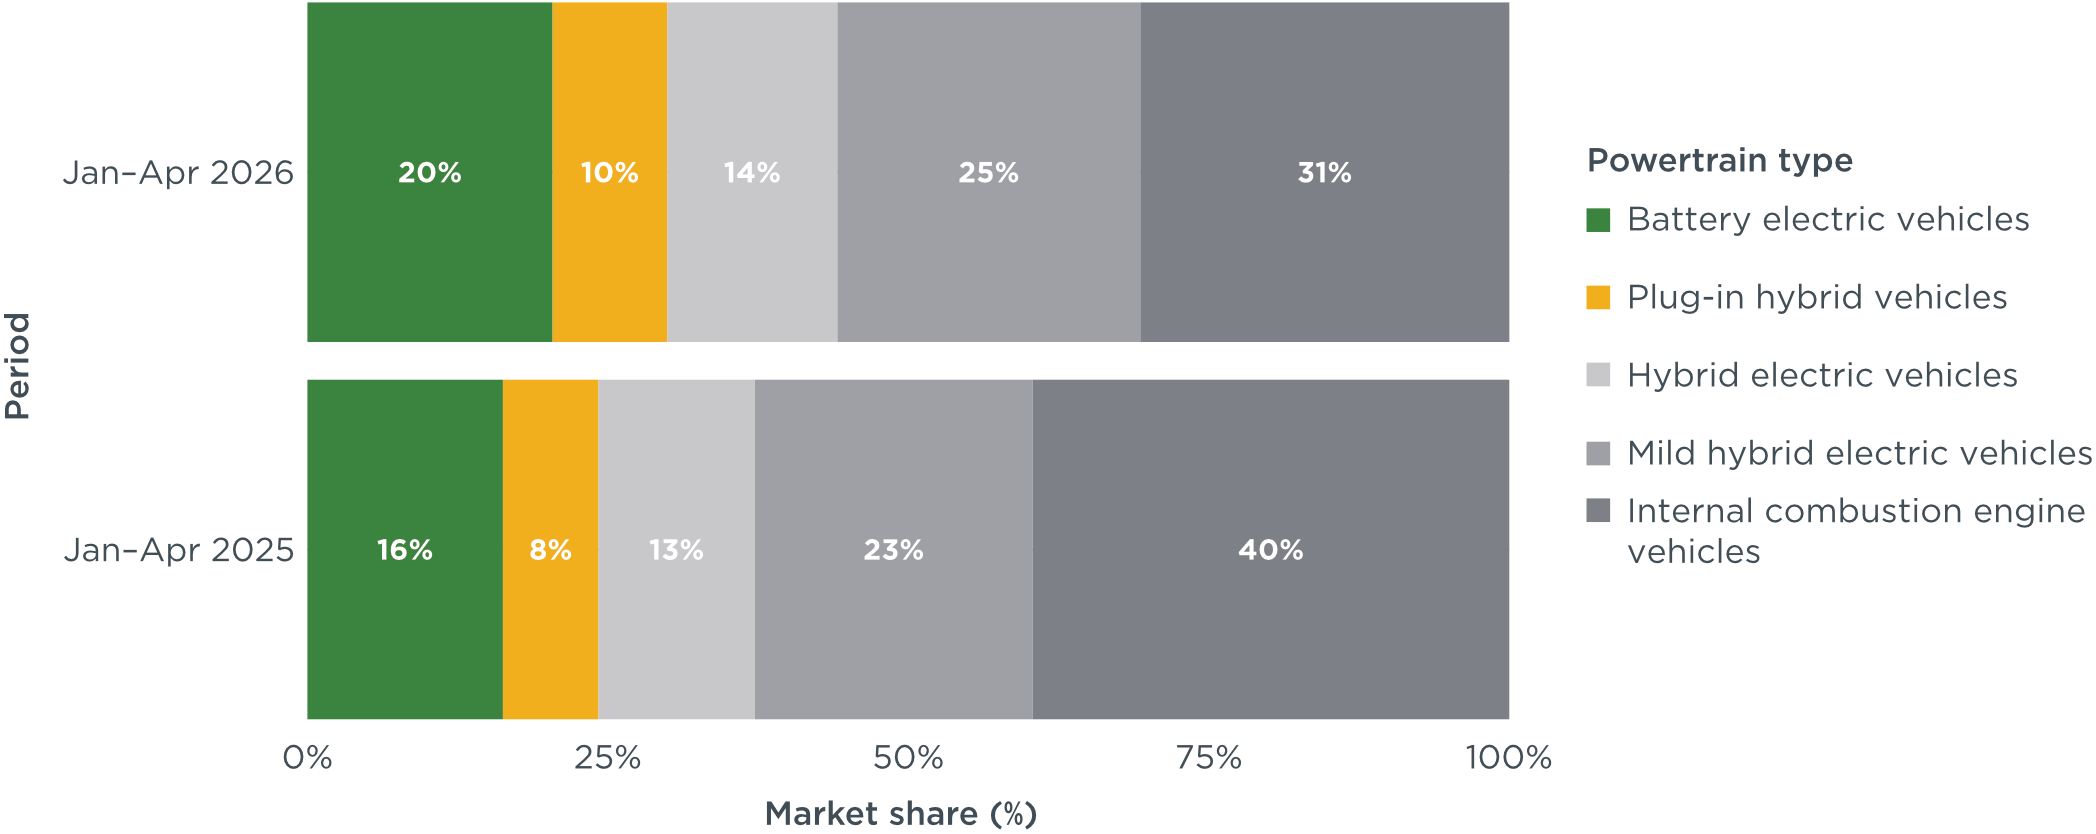
In January–April 2026, plug-in hybrid vehicles (PHEVs) had an average market share of 10% among new registrations in Europe, up 2 percentage points from January–April 2025.
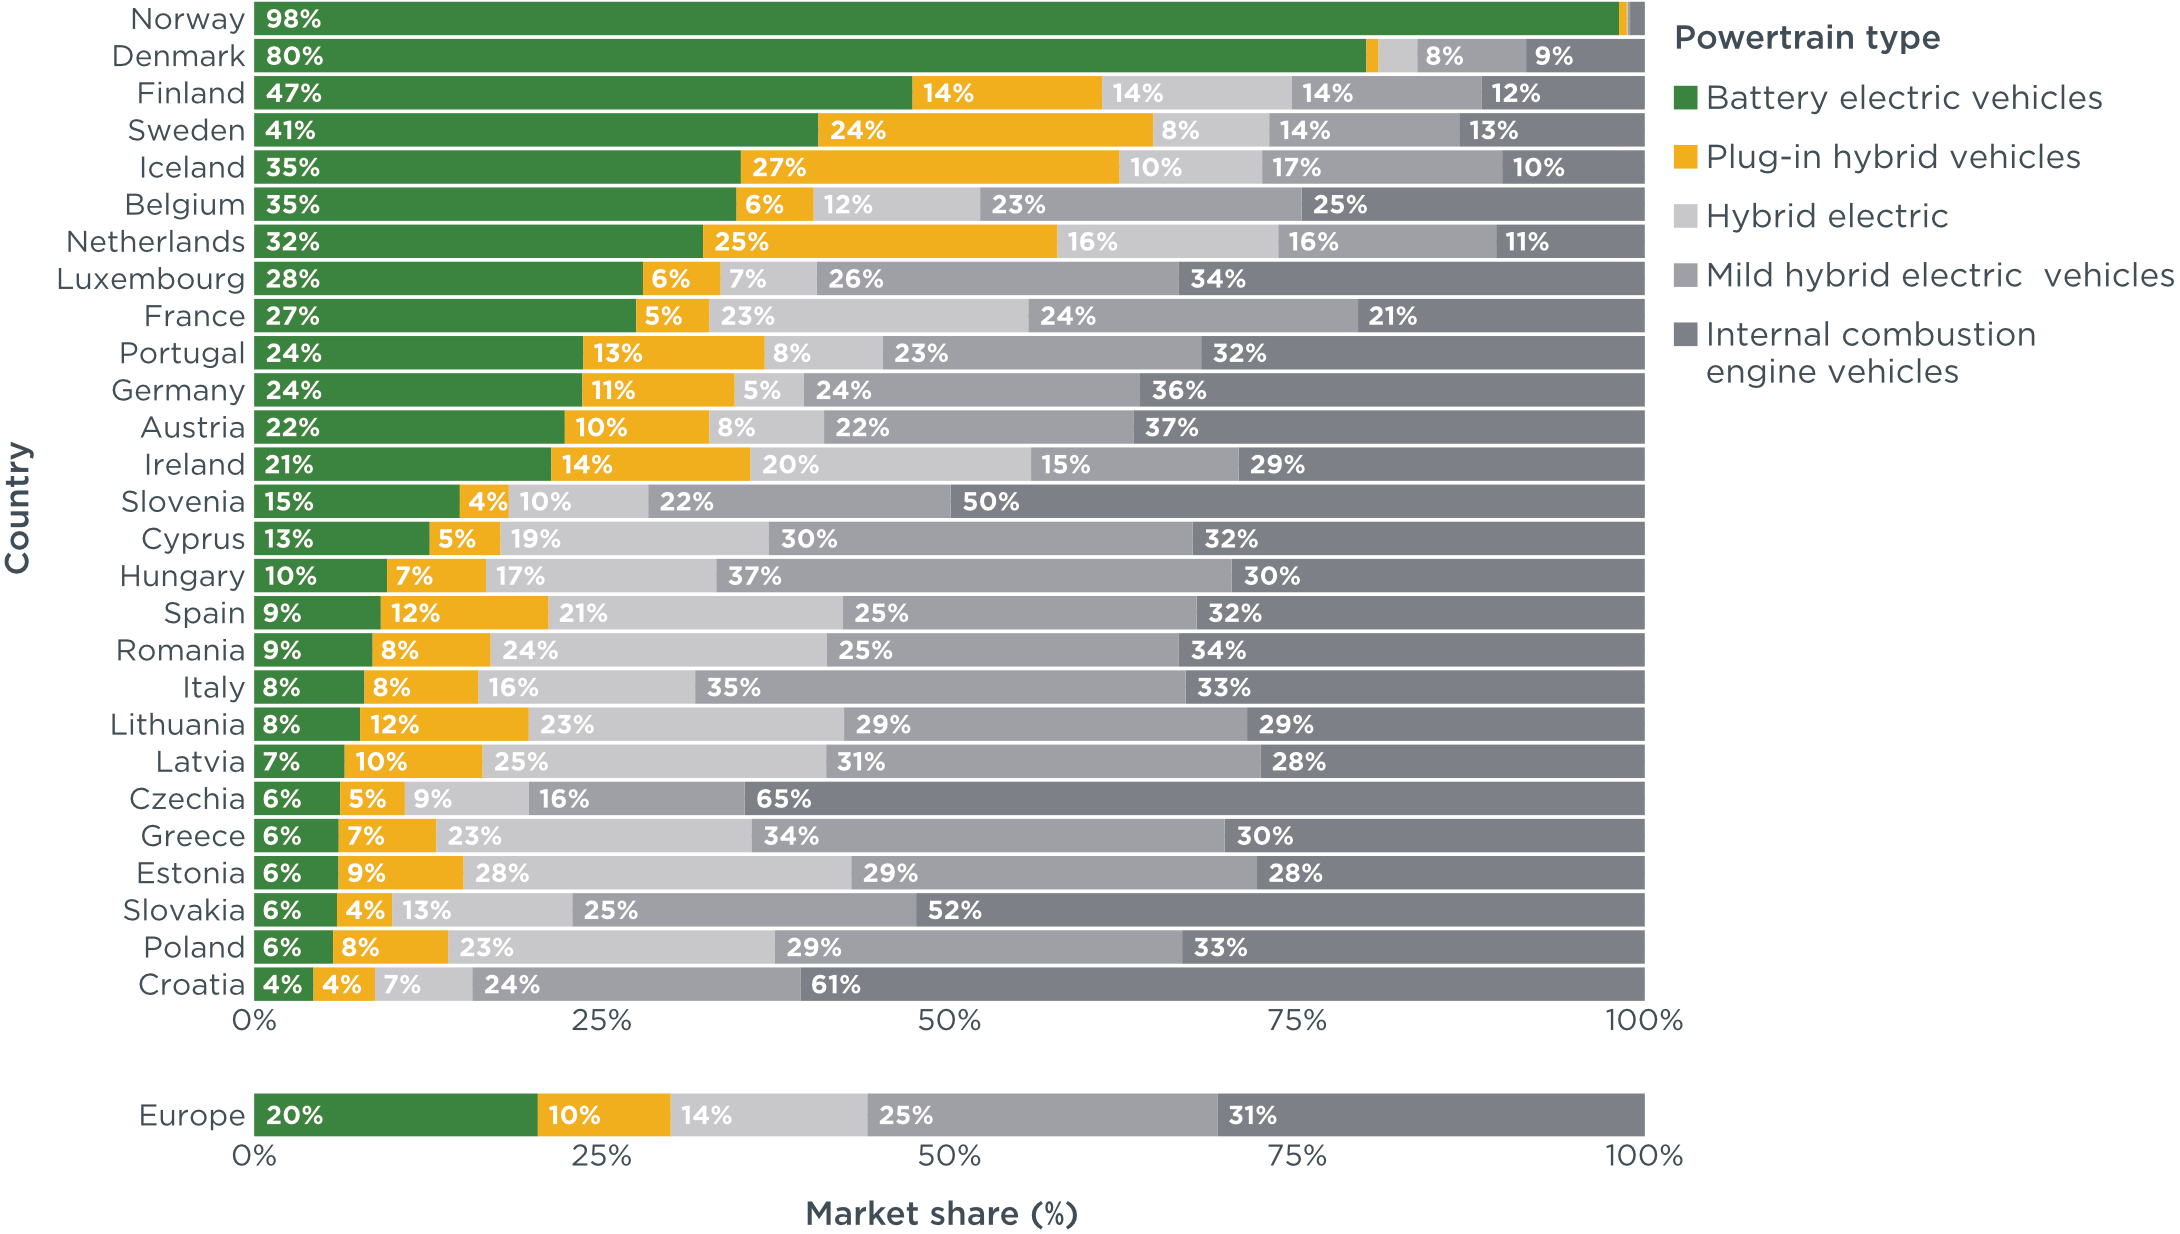
Compared with the same period in 2025, full hybrid electric vehicles (HEVs) and mild hybrid electric vehicles (MHEVs) increased in market share by 1 and 2 percentage points, respectively, reaching shares of 14% and 25% in January–April 2026. Meanwhile, conventional internal combustion engine vehicles (ICEVs) comprised 31% of new registrations in January–April 2026. This is 9 percentage points lower than in the same period in 2025.
Figure 2
Market share of new passenger cars in Europe by powertrain type, January-April 2026 compared with January-April 2025.
Registrations increased in most of the 10 largest European markets in April 2026, with Italy registering the biggest increase (+11%) compared with April 2025 (see Table A5 in the Appendix). Looking at new BEV registrations in January–April 2026, Germany and Italy—currently Europe’s largest car markets—had BEV market shares of 24% and 8%, respectively. These represent increases of 7 and 3 percentage points, respectively, compared with the same period in 2025. France and Spain, the third- and fourth-largest markets, had increases of 9 and 2 percentage points in January–April 2026, reaching BEV shares of 27% and 9%, respectively. Nordic countries led Europe’s battery electric car registration shares in January– April 2026, with Norway and Denmark already reaching shares of 98% and 80%, respectively, followed by Finland (47%) and Sweden (41%; Figure 3). Belgium and Iceland (both 35%), the Netherlands (32%), Luxembourg (28%), and France (27%) all had BEV shares of 25% or greater. In January–April 2026, Denmark recorded the greatest increase in BEV market share compared with the same period in the previous year (+16 percentage points).
Figure 3
Europe’s new car market share by country and powertrain type, January–April 2026
Under EU regulations, car manufacturers are required to progressively reduce the CO₂ emissions of new passenger cars through to 2035. The current target applies annually from 2025 to 2029. However, compliance will first be assessed at the end of 2027, based on the average CO₂ emissions of new passenger car fleets over the 2025-2027 period. Manufacturers may pool their emissions performance over these three years through pooling agreements (manufacturer pools) and can make use of compliance credits earned through the sale of zero- and low-emission vehicles (ZLEVs), as well as through the deployment of eco-innovations, meaning technologies that deliver real-world CO₂ savings beyond those measured during the standard type-approval test cycle. Increasing the share of battery electric vehicles remains the primary strategy used by manufacturers to achieve these reductions and avoid penalties.
In January-April 2026, manufacturers’ average CO₂ emissions stood at 96 g CO₂/km. After accounting for compliance credits, manufacturers were on average 3 g CO₂/km above their 2026 target (see Table A2 in the Appendix). Over the full period from January 2025 to April 2026, adjusted emissions averaged around 96 g CO₂/km. Including compliance credits, manufacturer pools remained 3 g CO₂/km below the average target of 93 g CO₂/km for the 2025-2027 period, unchanged from the gap recorded in 2025 (see Table A3 in the Appendix).
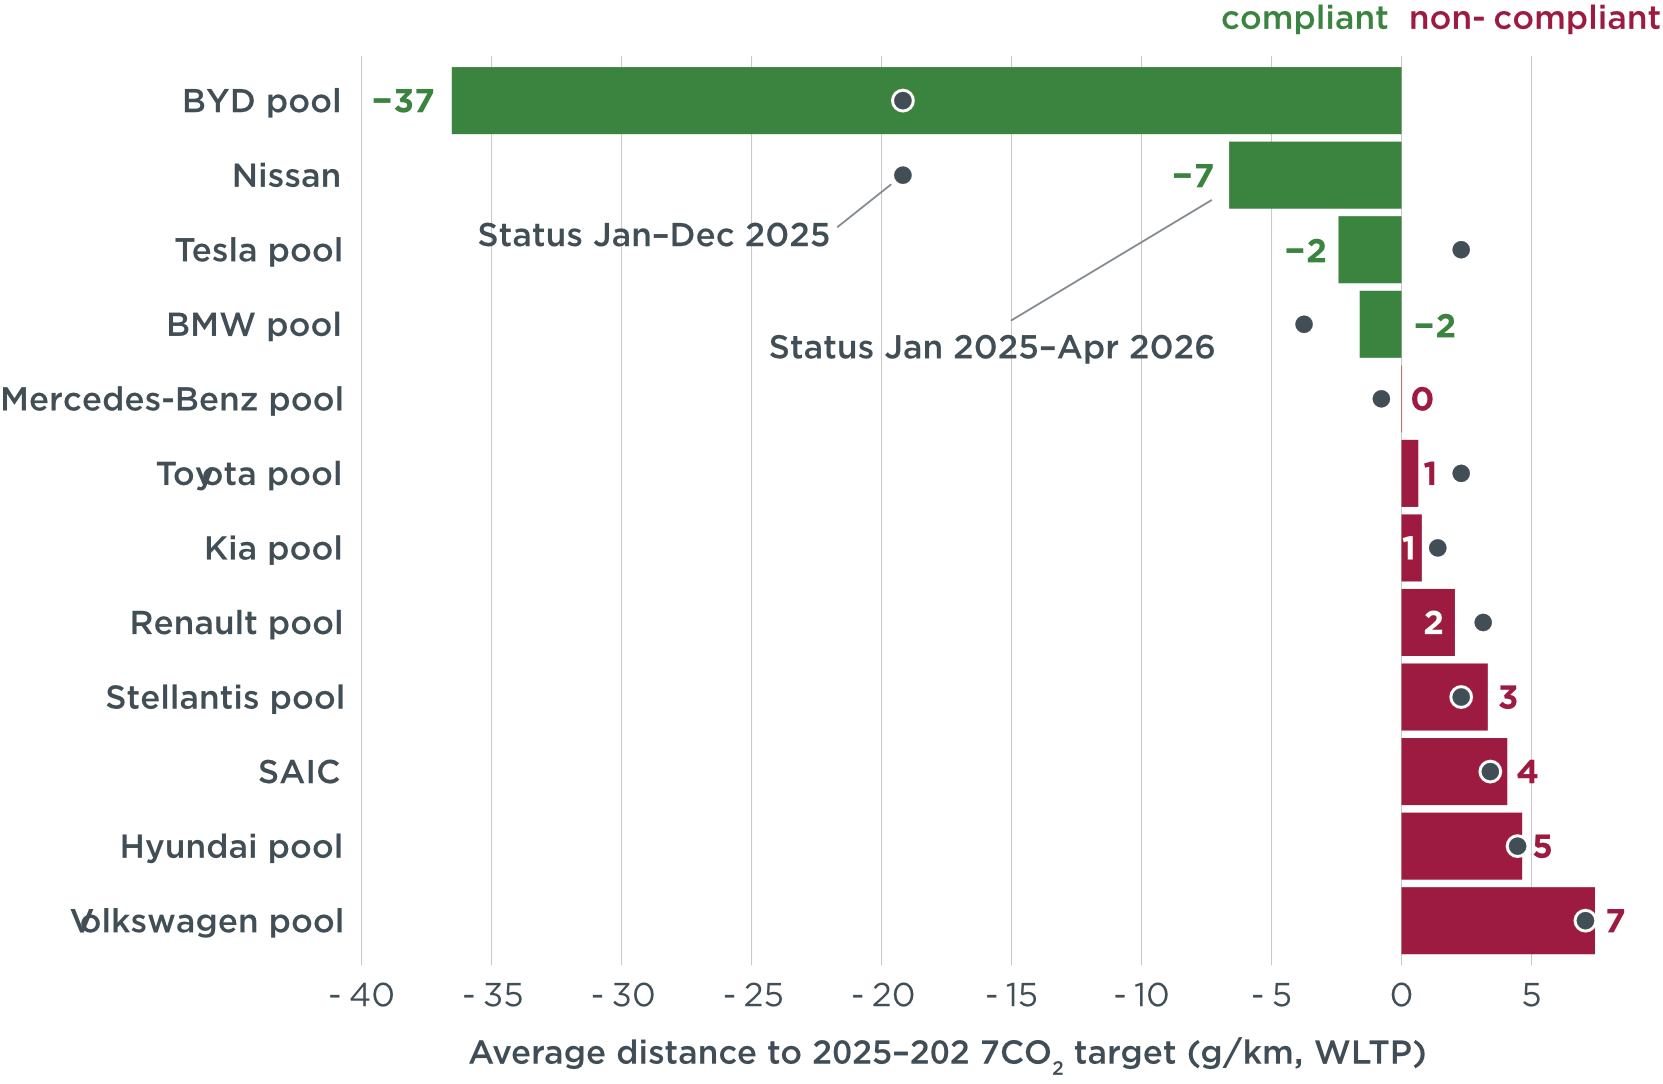
For the full period from January 2025 to April 2026, the BYD pool (37 g CO₂/km below target), Nissan (7 g CO₂/km below target), the Tesla and BMW pools (each 2 g CO₂/km below target), and the Mercedes-Benz pool (on target) were all on track to meet their 2025-2027 targets. In contrast, the Volkswagen pool (+7 g CO₂/km) remained the furthest from achieving its target.
Figure 4
Average distance to 2025–2027 CO2 targets for manufacturer pools and individual manufacturers
The BYD and Mercedes-Benz pools recorded the highest BEV registration shares in April 2026, at 40% and 32%, respectively. Kia (31%), BMW (28%), Tesla (27%), and Hyundai (22%) also achieved BEV shares above the European average of 21%. By contrast, Toyota (11%), SAIC, and Nissan (both 12%) recorded the lowest BEV shares in April (see Table A1 in the Appendix).
Looking at individual car brands with market shares of 1% or more, Tesla and BYD showed the greatest overcompliance, operating 92 g CO₂/km and 77 g CO₂/km, respectively, below their projected average brand-level targets for 2025-2027 by the end of April 2026. They were followed by Volvo (29 g CO₂/km below target), Mini (17 g CO₂/km below target), and Cupra (16 g CO₂/km below target). Nissan (28 g CO₂/km above target), SEAT (24 g CO₂/km above target), Mercedes-Benz (20 g CO₂/km above target), and Mazda (20 g CO₂/km above target) exhibited the largest compliance gaps (see Table A4 in the Appendix).
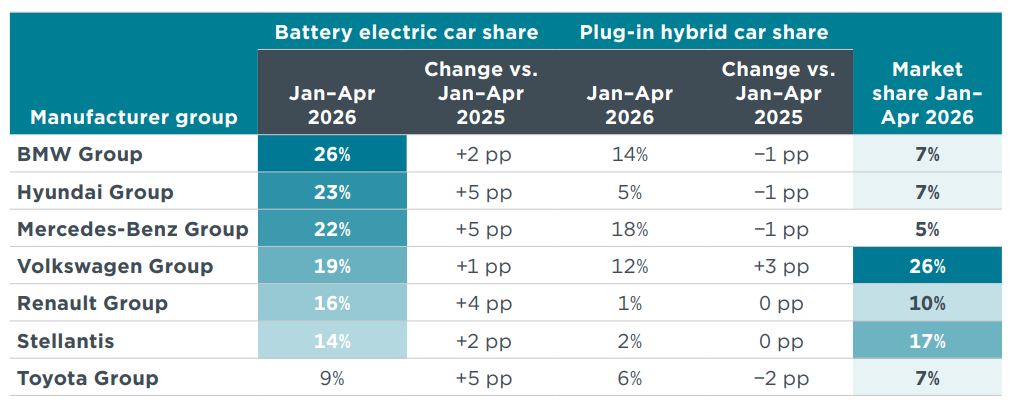
Among the largest manufacturers, BMW Group recorded the highest BEV share in January-April 2026, at 26%. Hyundai Group, Mercedes-Benz Group, and Toyota each increased their BEV shares by 5 percentage points compared with January-April 2025, with Toyota more than doubling its share from 4% to 9% (Table 1). Volkswagen Group, which held a 26% market share in January-April 2026, increased its PHEV share by 3 percentage points compared with the same period in 2025.
Table 1
Share of battery electric and plug-in hybrid passenger cars among the seven largest manufacturer groups, January-April 2026.
Of all powertrain types, battery electric passenger cars offer the greatest potential for reducing overall CO₂ emissions.² When considering only new registrations of internal combustion engine vehicles (ICEVs), including full hybrids (HEVs) and mild hybrids (MHEVs), average CO₂ emissions stood at 131 g CO₂/km in January-April 2026. Including plug-in hybrid vehicles (PHEVs) reduced the average to 121 g CO₂/km, while the growing market share of BEVs further lowered average CO₂ emissions by an additional 25 g CO₂/km during the January-April period.
Figure 5
Average CO₂ emissions of newly registered internal combustion engine vehicles and average fleet emission reductions associated with the inclusion of electrified powertrains.
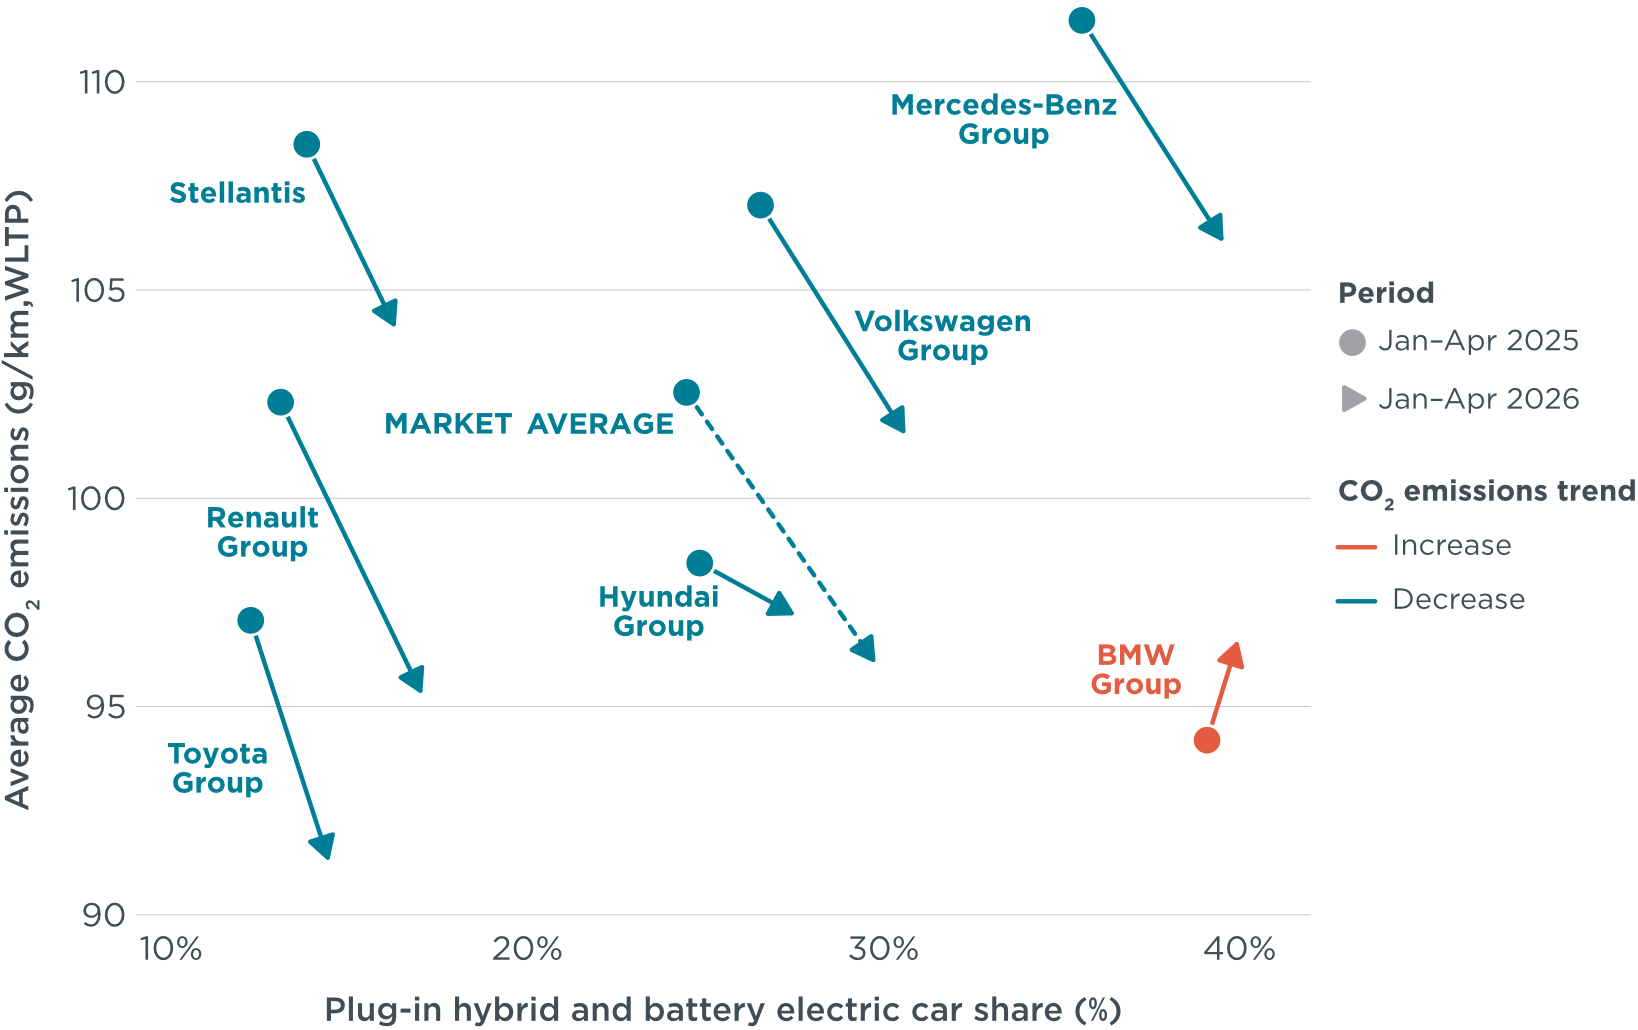
Analysing the relationship between electric vehicle market shares and average CO₂ emissions, Mercedes-Benz Group recorded the highest average CO₂ emissions among Europe’s major manufacturers, despite having the second-highest combined share of PHEVs and BEVs in both January-April 2025 and January-April 2026. This was largely due to the high average CO₂ emissions of the group’s non-electrified powertrains, which stood at around 163 g CO₂/km in January-April 2026, the highest level among Europe’s largest manufacturer groups.
As a contrasting example, Toyota, with its strong focus on hybrid powertrains, recorded average CO₂ emissions below its 2026 target in January-April, despite maintaining the lowest electric vehicle share.
Among Europe’s major manufacturers, BMW Group is the only case where emissions increased in 2026 compared with the previous year. This disparity is partly explained by an increase in the reported emissions of PHEVs to more realistic levels, following the European Commission’s adjustment of the assumed electric driving share used for type approval at the beginning of the year. However, it also reflects a pattern observed in previous CO₂ target cycles: in the absence of annual interim targets, manufacturers often reduce their CO₂ reduction efforts once they have achieved their defined emissions target, rather than maintaining momentum towards the next target within a continuous reduction pathway. Historically, these delayed efforts have resulted in manufacturers claiming that established targets cannot be met and requesting last-minute policy interventions to weaken the targets.³
Figure 6
Average fleet CO₂ emissions compared with electric vehicle market share by manufacturer group, January-April 2026 versus January-April 2025.
³ Sonsoles Díaz et al., CO₂ Emissions from New Passenger Cars in Europe: Car Manufacturers’ Performance in 2024(International Council on Clean Transportation, 2025), https://theicct.org/publication/co2-emissions-from-new-passenger-cars-in-europe-car-manufacturers-performance-in-2024-dec25/.
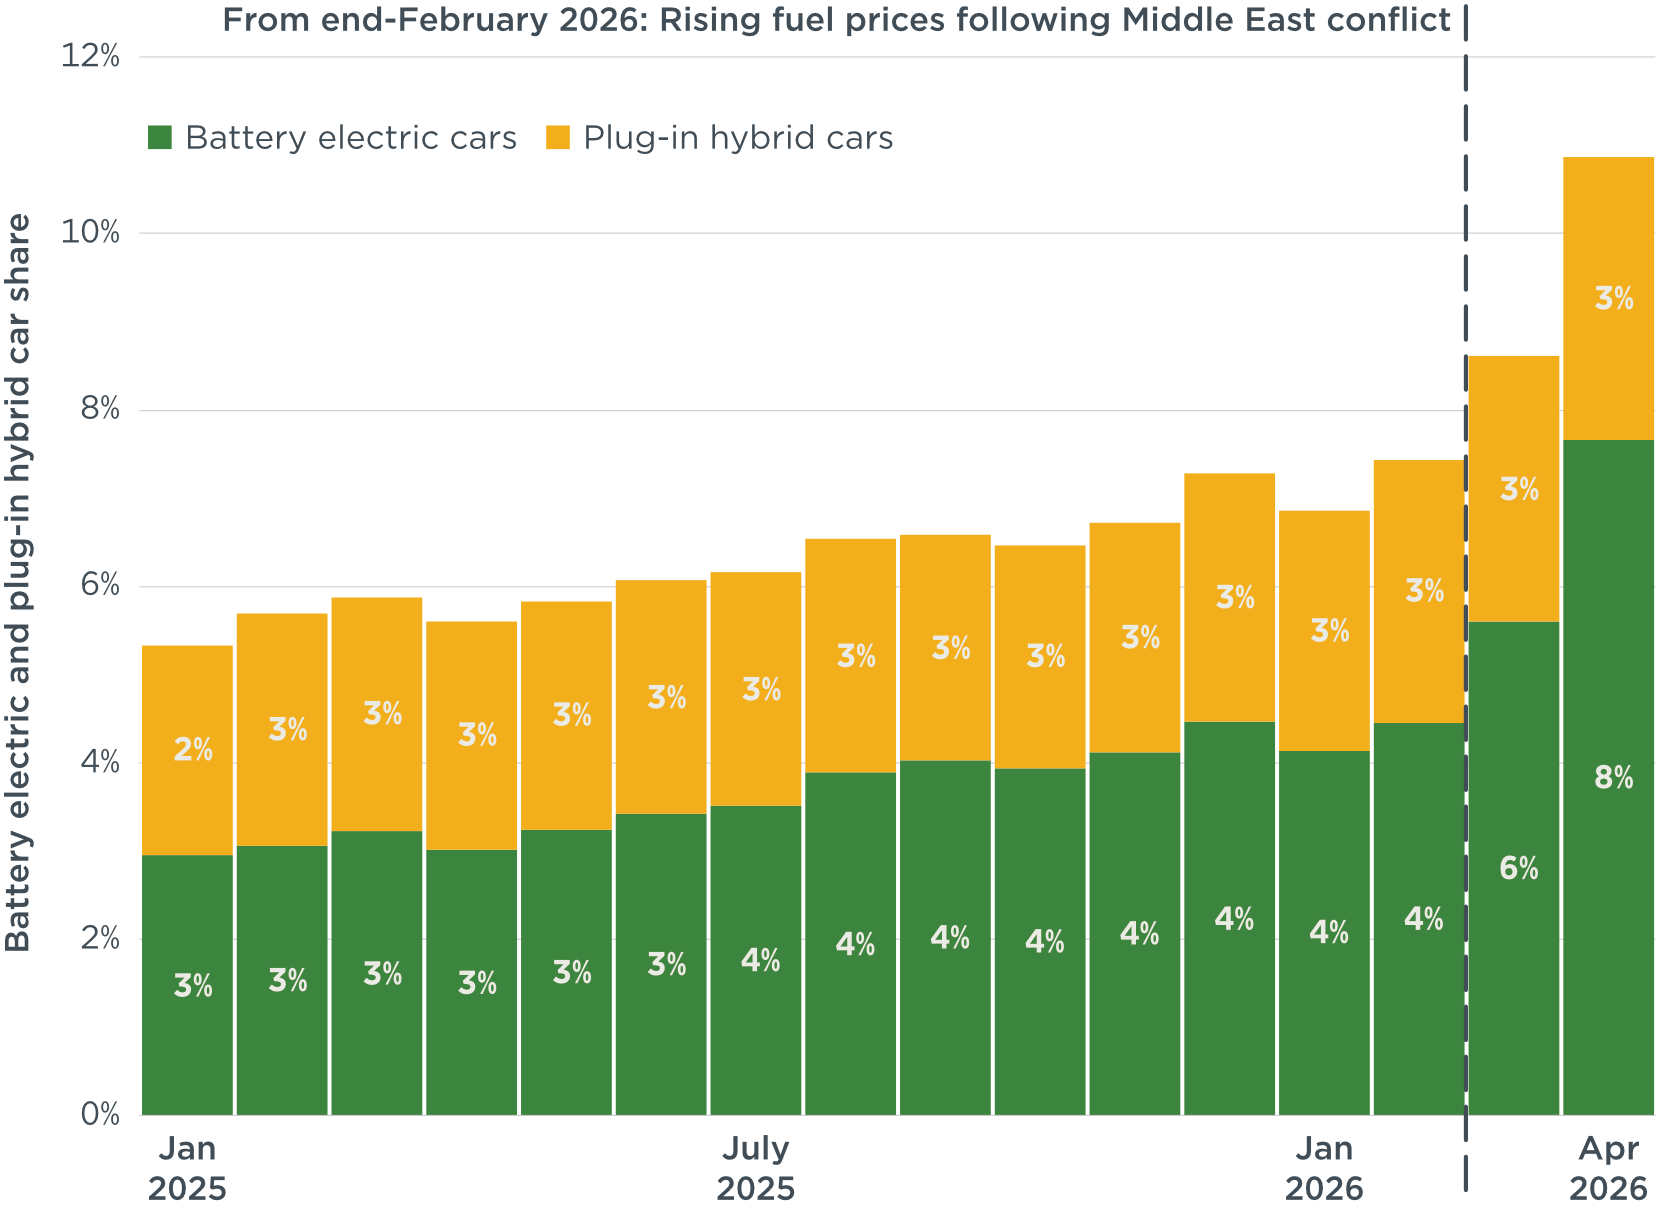
The second-hand EV market in Germany is gaining momentum. The combined share of BEVs and PHEVs in used vehicle registrations (measured as vehicle ownership transfers) nearly doubled between April 2025 and April 2026, rising from 5.6% to 10.9%. This growth was driven primarily by BEVs, whose share increased from 3.0% to 7.7% over the same period, while the share of PHEVs remained relatively stable, moving from 2.6% to 3.2%.
Growth in the absolute number of used BEV registrations also accelerated significantly, increasing year-on-year by 25% in January, 40% in February, 89% in March and 147% in April. By comparison, used PHEV registrations grew more moderately, by 2% in January, 9% in February, 24% in March and 20% in April. Overall, between January-April 2025 and January-April 2026, used BEV registrations increased by 77%, compared with 14% for PHEVs.
The second-hand market is critical for scaling BEV adoption. In Germany, it accounts for more than twice as many vehicle registrations as the new vehicle market (6.51 million versus 2.86 million in 2025), meaning that more affordable used vehicles are available to a broader group of consumers, supporting the transition to battery electric vehicles.
Figure 7
Share of battery electric and plug-in hybrid passenger cars in used passenger car registrations in Germany, January 2025-April 2026.
The think tanks Agora Verkehrswende (Germany), alinnea (Spain), ECCO Climate (Italy), the International Council on Clean Transportation (ICCT), the Mobility in Transition Institute (IDDRI-IMT, France), and the Polish Association for New Mobility (PSNM, Poland) publish monthly data on the average specific emissions of newly registered vehicle fleets in the European Economic Area, both overall and by country.
These data make it possible to track manufacturers’ compliance gap with respect to the CO₂ reduction targets (Regulation 2019/631) set for the 2025–2027 period, as well as the reduction of CO₂ emissions from new vehicles through 2035.
alinnea provides the report data with a particular focus on Spain, the fourth-largest automotive market in Europe.